

Air quality expert group - Fine particulate matter (PM2.5) in ... - Defra
Air quality expert group - Fine particulate matter (PM2.5) in ... - Defra
Air quality expert group - Fine particulate matter (PM2.5) in ... - Defra

Create successful ePaper yourself
Turn your PDF publications into a flip-book with our unique Google optimized e-Paper software.
problematical, and which is also illustrative of the general problem of evaluat<strong>in</strong>g<br />
<strong>PM2.5</strong> models because of uncerta<strong>in</strong>ties regard<strong>in</strong>g measured data.<br />
PM 2.5 (µg/m³)<br />
25<br />
20<br />
15<br />
10<br />
5<br />
0<br />
490000 510000 530000<br />
East<strong>in</strong>g, metres<br />
PCM 2009<br />
ADMS high resolution 2008<br />
ADMS 1km resolution 2008<br />
FDMS 2009<br />
Partisol 2009<br />
FDMS 2008<br />
550000 570000<br />
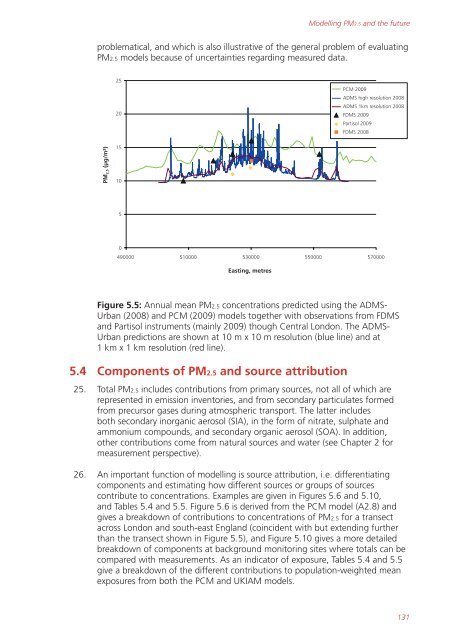
Figure 5.5: Annual mean <strong>PM2.5</strong> concentrations predicted us<strong>in</strong>g the ADMS-<br />
Urban (2008) and PCM (2009) models together with observations from FDMS<br />
and Partisol <strong>in</strong>struments (ma<strong>in</strong>ly 2009) though Central London. The ADMS-<br />
Urban predictions are shown at 10 m x 10 m resolution (blue l<strong>in</strong>e) and at<br />
1 km x 1 km resolution (red l<strong>in</strong>e).<br />
5.4 Components of <strong>PM2.5</strong> and source attribution<br />
Modell<strong>in</strong>g <strong>PM2.5</strong> and the future<br />
25. Total <strong>PM2.5</strong> <strong>in</strong>cludes contributions from primary sources, not all of which are<br />
represented <strong>in</strong> emission <strong>in</strong>ventories, and from secondary <strong>particulate</strong>s formed<br />
from precursor gases dur<strong>in</strong>g atmospheric transport. The latter <strong>in</strong>cludes<br />
both secondary <strong>in</strong>organic aerosol (SIA), <strong>in</strong> the form of nitrate, sulphate and<br />
ammonium compounds, and secondary organic aerosol (SOA). In addition,<br />
other contributions come from natural sources and water (see Chapter 2 for<br />
measurement perspective).<br />
26. An important function of modell<strong>in</strong>g is source attribution, i.e. differentiat<strong>in</strong>g<br />
components and estimat<strong>in</strong>g how different sources or <strong>group</strong>s of sources<br />
contribute to concentrations. Examples are given <strong>in</strong> Figures 5.6 and 5.10,<br />
and Tables 5.4 and 5.5. Figure 5.6 is derived from the PCM model (A2.8) and<br />
gives a breakdown of contributions to concentrations of <strong>PM2.5</strong> for a transect<br />
across London and south-east England (co<strong>in</strong>cident with but extend<strong>in</strong>g further<br />
than the transect shown <strong>in</strong> Figure 5.5), and Figure 5.10 gives a more detailed<br />
breakdown of components at background monitor<strong>in</strong>g sites where totals can be<br />
compared with measurements. As an <strong>in</strong>dicator of exposure, Tables 5.4 and 5.5<br />
give a breakdown of the different contributions to population-weighted mean<br />
exposures from both the PCM and UKIAM models.<br />
131


