

Air quality expert group - Fine particulate matter (PM2.5) in ... - Defra
Air quality expert group - Fine particulate matter (PM2.5) in ... - Defra
Air quality expert group - Fine particulate matter (PM2.5) in ... - Defra

You also want an ePaper? Increase the reach of your titles
YUMPU automatically turns print PDFs into web optimized ePapers that Google loves.
CI – concentration (µg m -3 )<br />
5<br />
4<br />
3<br />
2<br />
1<br />
0<br />
Jan-08<br />
Average measured vs modelled daily CI - concentration<br />
Feb-08 Mar-08 Apr-08 May-08 Jun-08 Jul-08 Aug-08 Sep-08 Oct-08 Nov-08 Dec-08<br />
observed chloride modelled chloride<br />
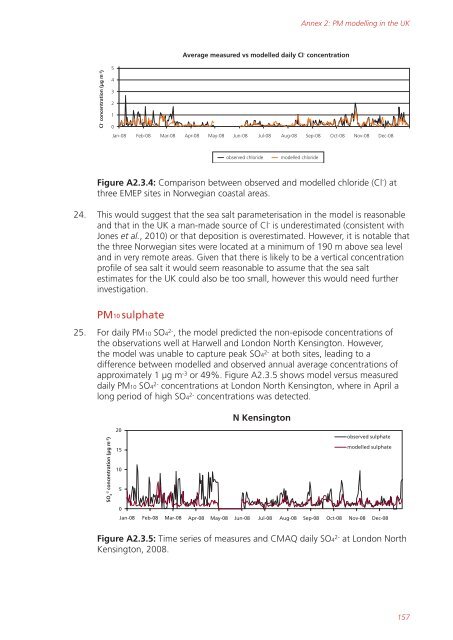
Figure A2.3.4: Comparison between observed and modelled chloride (Cl - ) at<br />
three EMEP sites <strong>in</strong> Norwegian coastal areas.<br />
24. This would suggest that the sea salt parameterisation <strong>in</strong> the model is reasonable<br />
and that <strong>in</strong> the UK a man-made source of Cl - is underestimated (consistent with<br />
Jones et al., 2010) or that deposition is overestimated. However, it is notable that<br />
the three Norwegian sites were located at a m<strong>in</strong>imum of 190 m above sea level<br />
and <strong>in</strong> very remote areas. Given that there is likely to be a vertical concentration<br />
profile of sea salt it would seem reasonable to assume that the sea salt<br />
estimates for the UK could also be too small, however this would need further<br />
<strong>in</strong>vestigation.<br />
PM10 sulphate<br />
25. For daily PM10 SO4 2- , the model predicted the non-episode concentrations of<br />
the observations well at Harwell and London North Kens<strong>in</strong>gton. However,<br />
the model was unable to capture peak SO4 2- at both sites, lead<strong>in</strong>g to a<br />
difference between modelled and observed annual average concentrations of<br />
approximately 1 µg m -3 or 49%. Figure A2.3.5 shows model versus measured<br />
daily PM10 SO4 2- concentrations at London North Kens<strong>in</strong>gton, where <strong>in</strong> April a<br />
long period of high SO4 2- concentrations was detected.<br />
-2 concentration (µg m -3 )<br />
SO 4<br />
20<br />
15<br />
10<br />
5<br />
0<br />
N Kens<strong>in</strong>gton<br />
Annex 2: PM modell<strong>in</strong>g <strong>in</strong> the UK<br />
observed sulphate<br />
modelled sulphate<br />
Jan-08 Feb-08 Mar-08 Apr-08 May-08 Jun-08 Jul-08 Aug-08 Sep-08 Oct-08 Nov-08 Dec-08<br />
Figure A2.3.5: Time series of measures and CMAQ daily SO4 2- at London North<br />
Kens<strong>in</strong>gton, 2008.<br />
157


