

Air quality expert group - Fine particulate matter (PM2.5) in ... - Defra
Air quality expert group - Fine particulate matter (PM2.5) in ... - Defra
Air quality expert group - Fine particulate matter (PM2.5) in ... - Defra

You also want an ePaper? Increase the reach of your titles
YUMPU automatically turns print PDFs into web optimized ePapers that Google loves.
<strong>PM2.5</strong> <strong>in</strong> the UK<br />
52<br />
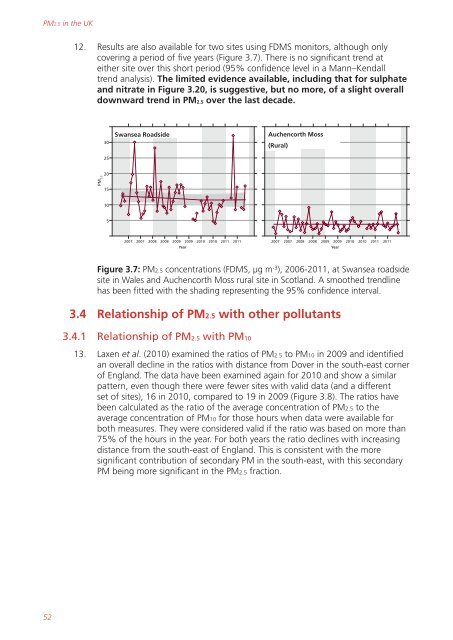
12. Results are also available for two sites us<strong>in</strong>g FDMS monitors, although only<br />
cover<strong>in</strong>g a period of five years (Figure 3.7). There is no significant trend at<br />
either site over this short period (95% confidence level <strong>in</strong> a Mann–Kendall<br />
trend analysis). The limited evidence available, <strong>in</strong>clud<strong>in</strong>g that for sulphate<br />
and nitrate <strong>in</strong> Figure 3.20, is suggestive, but no more, of a slight overall<br />
downward trend <strong>in</strong> <strong>PM2.5</strong> over the last decade.<br />
PM 2.5<br />
30<br />
25<br />
20<br />
15<br />
10<br />
5<br />
Swansea Roadside<br />
2007 2007 2008 2008 2009<br />
Year<br />
2009 2010 2010 2011 2011<br />
Auchencorth Moss<br />
(Rural)<br />
2007 2007 2008 2008 2009<br />
2009 2010 2010 2011 2011<br />
Figure 3.7: <strong>PM2.5</strong> concentrations (FDMS, µg m -3 ), 2006-2011, at Swansea roadside<br />
site <strong>in</strong> Wales and Auchencorth Moss rural site <strong>in</strong> Scotland. A smoothed trendl<strong>in</strong>e<br />
has been fitted with the shad<strong>in</strong>g represent<strong>in</strong>g the 95% confidence <strong>in</strong>terval.<br />
3.4 Relationship of <strong>PM2.5</strong> with other pollutants<br />
3.4.1 Relationship of <strong>PM2.5</strong> with PM10<br />
13. Laxen et al. (2010) exam<strong>in</strong>ed the ratios of <strong>PM2.5</strong> to PM10 <strong>in</strong> 2009 and identified<br />
an overall decl<strong>in</strong>e <strong>in</strong> the ratios with distance from Dover <strong>in</strong> the south-east corner<br />
of England. The data have been exam<strong>in</strong>ed aga<strong>in</strong> for 2010 and show a similar<br />
pattern, even though there were fewer sites with valid data (and a different<br />
set of sites), 16 <strong>in</strong> 2010, compared to 19 <strong>in</strong> 2009 (Figure 3.8). The ratios have<br />
been calculated as the ratio of the average concentration of <strong>PM2.5</strong> to the<br />
average concentration of PM10 for those hours when data were available for<br />
both measures. They were considered valid if the ratio was based on more than<br />
75% of the hours <strong>in</strong> the year. For both years the ratio decl<strong>in</strong>es with <strong>in</strong>creas<strong>in</strong>g<br />
distance from the south-east of England. This is consistent with the more<br />
significant contribution of secondary PM <strong>in</strong> the south-east, with this secondary<br />
PM be<strong>in</strong>g more significant <strong>in</strong> the <strong>PM2.5</strong> fraction.<br />
Year


