

Air quality expert group - Fine particulate matter (PM2.5) in ... - Defra
Air quality expert group - Fine particulate matter (PM2.5) in ... - Defra
Air quality expert group - Fine particulate matter (PM2.5) in ... - Defra

You also want an ePaper? Increase the reach of your titles
YUMPU automatically turns print PDFs into web optimized ePapers that Google loves.
<strong>PM2.5</strong> <strong>in</strong> the UK<br />
172<br />
trajectory model. The ADMS algorithms <strong>in</strong>clude allowance for the impacts of<br />
plume rise, street canyons and traffic-produced turbulence; they also <strong>in</strong>clude a<br />
simplified chemistry scheme which <strong>in</strong>cludes generation of sulphate and nitrate<br />
<strong>particulate</strong>s.<br />
67. The follow<strong>in</strong>g data are taken from the results of ADMS-Urban calculations for<br />
<strong>PM2.5</strong> undertaken as part of the model <strong>in</strong>ter-comparison study (Carslaw et al.,<br />
2011) for London for 2008. This study also considered other pollutant species<br />
(PM10, NOx, NO2 and ozone) and the results of a number of other models. In this<br />
example, emissions data were either used directly from the London Atmospheric<br />
Emission Inventory for 2008 (LAEI, 2008) <strong>in</strong> the case of roads, or derived from<br />
PM10 us<strong>in</strong>g factors relat<strong>in</strong>g <strong>PM2.5</strong> to PM10 emissions (AQEG, 2005) (for emissions<br />
from agriculture, airports, the combustion of domestic coal, domestic gas,<br />
domestic oil, <strong>in</strong>dustrial coal and <strong>in</strong>dustrial gas, natural sources, shipp<strong>in</strong>g and the<br />
use of solvents).<br />
68. In this study the background concentrations of <strong>PM2.5</strong> were accounted for us<strong>in</strong>g<br />
monitored data for the year 2008 from the sites at Rochester and Harwell<br />
depend<strong>in</strong>g on the w<strong>in</strong>d direction. The Heathrow site was used to provide hourly<br />
sequential meteorological data for <strong>in</strong>put <strong>in</strong>to the model.<br />
Calculated annual average (µg/m 3 )<br />
25<br />
20<br />
15<br />
10<br />
5<br />
<strong>PM2.5</strong> annual average scatter plot<br />
0<br />
0 5 10 15 20 25<br />
Monitored annual average (µg/m 3 )<br />
Background<br />
Roadside<br />
Roadside AURN<br />
Background AURN<br />
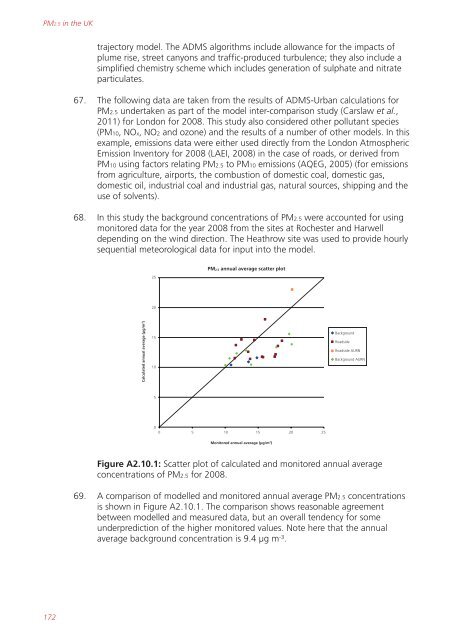
Figure A2.10.1: Scatter plot of calculated and monitored annual average<br />
concentrations of <strong>PM2.5</strong> for 2008.<br />
69. A comparison of modelled and monitored annual average <strong>PM2.5</strong> concentrations<br />
is shown <strong>in</strong> Figure A2.10.1. The comparison shows reasonable agreement<br />
between modelled and measured data, but an overall tendency for some<br />
underprediction of the higher monitored values. Note here that the annual<br />
average background concentration is 9.4 µg m -3 .


