

Air quality expert group - Fine particulate matter (PM2.5) in ... - Defra
Air quality expert group - Fine particulate matter (PM2.5) in ... - Defra
Air quality expert group - Fine particulate matter (PM2.5) in ... - Defra

You also want an ePaper? Increase the reach of your titles
YUMPU automatically turns print PDFs into web optimized ePapers that Google loves.
<strong>PM2.5</strong> <strong>in</strong> the UK<br />
60<br />
south. Further analysis of more sites cover<strong>in</strong>g a greater spatial area would yield<br />
more <strong>in</strong>formation on the regional differences. Note that similar patterns were<br />
observed when remov<strong>in</strong>g the <strong>PM2.5</strong> associated with local NOx concentrations<br />
(not shown), which highlights that the patterns <strong>in</strong> Figure 3.13 are most strongly<br />
associated with non-local sources.<br />
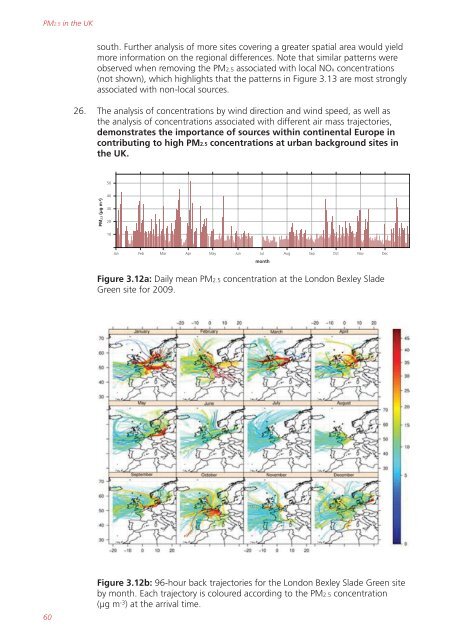
26. The analysis of concentrations by w<strong>in</strong>d direction and w<strong>in</strong>d speed, as well as<br />
the analysis of concentrations associated with different air mass trajectories,<br />
demonstrates the importance of sources with<strong>in</strong> cont<strong>in</strong>ental Europe <strong>in</strong><br />
contribut<strong>in</strong>g to high <strong>PM2.5</strong> concentrations at urban background sites <strong>in</strong><br />
the UK.<br />
<strong>PM2.5</strong> (µg m -3)<br />
50<br />
40<br />
30<br />
20<br />
10<br />
Jan Feb Mar Apr May Jun Jul Aug Sep<br />
month<br />
Oct Nov Dec<br />
Figure 3.12a: Daily mean <strong>PM2.5</strong> concentration at the London Bexley Slade<br />
Green site for 2009.<br />
Figure 3.12b: 96-hour back trajectories for the London Bexley Slade Green site<br />
by month. Each trajectory is coloured accord<strong>in</strong>g to the <strong>PM2.5</strong> concentration<br />
(µg m -3 ) at the arrival time.


