

Air quality expert group - Fine particulate matter (PM2.5) in ... - Defra
Air quality expert group - Fine particulate matter (PM2.5) in ... - Defra
Air quality expert group - Fine particulate matter (PM2.5) in ... - Defra

You also want an ePaper? Increase the reach of your titles
YUMPU automatically turns print PDFs into web optimized ePapers that Google loves.
3.3 Trends <strong>in</strong> <strong>PM2.5</strong> concentrations<br />
Concentrations and composition of <strong>PM2.5</strong><br />
10. No monitor<strong>in</strong>g sites have been identified with long data runs (> 5 years) us<strong>in</strong>g<br />
reference equivalent <strong>in</strong>struments for <strong>PM2.5</strong>. There are, therefore, no reliable<br />
trend data available for <strong>PM2.5</strong>.<br />
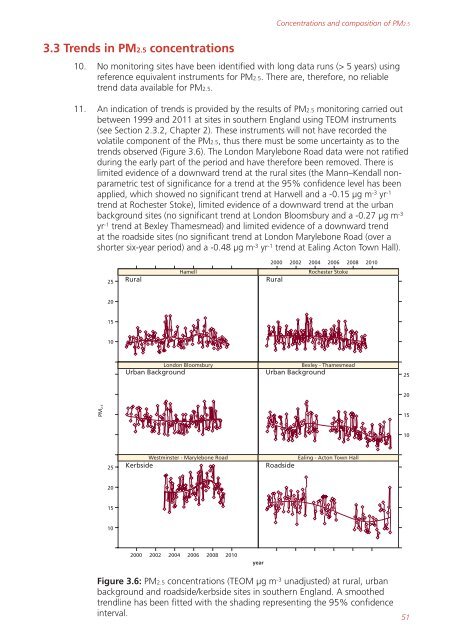
11. An <strong>in</strong>dication of trends is provided by the results of <strong>PM2.5</strong> monitor<strong>in</strong>g carried out<br />
between 1999 and 2011 at sites <strong>in</strong> southern England us<strong>in</strong>g TEOM <strong>in</strong>struments<br />
(see Section 2.3.2, Chapter 2). These <strong>in</strong>struments will not have recorded the<br />
volatile component of the <strong>PM2.5</strong>, thus there must be some uncerta<strong>in</strong>ty as to the<br />
trends observed (Figure 3.6). The London Marylebone Road data were not ratified<br />
dur<strong>in</strong>g the early part of the period and have therefore been removed. There is<br />
limited evidence of a downward trend at the rural sites (the Mann–Kendall nonparametric<br />
test of significance for a trend at the 95% confidence level has been<br />
applied, which showed no significant trend at Harwell and a -0.15 µg m -3 yr -1<br />
trend at Rochester Stoke), limited evidence of a downward trend at the urban<br />
background sites (no significant trend at London Bloomsbury and a -0.27 µg m -3<br />
yr -1 trend at Bexley Thamesmead) and limited evidence of a downward trend<br />
at the roadside sites (no significant trend at London Marylebone Road (over a<br />
shorter six-year period) and a -0.48 µg m -3 yr -1 trend at Eal<strong>in</strong>g Acton Town Hall).<br />
PM 2.5<br />
2000 2002 2004 2006 2008 2010<br />
Hamell Rochester Stoke<br />
25 Rural Rural<br />
20<br />
15<br />
10<br />
25<br />
20<br />
15<br />
10<br />
London Bloomsbury Bexley - Thamesmead<br />
Urban Background Urban Background<br />
Westm<strong>in</strong>ster - Marylebone Road Eal<strong>in</strong>g - Acton Town Hall<br />
Kerbside Roadside<br />
2000 2002 2004 2006 2008 2010<br />
Figure 3.6: <strong>PM2.5</strong> concentrations (TEOM µg m -3 unadjusted) at rural, urban<br />
background and roadside/kerbside sites <strong>in</strong> southern England. A smoothed<br />
trendl<strong>in</strong>e has been fitted with the shad<strong>in</strong>g represent<strong>in</strong>g the 95% confidence<br />
<strong>in</strong>terval.<br />
year<br />
25<br />
20<br />
15<br />
10<br />
51


