CANoe DENoe - KEMT FEI TUKE
CANoe DENoe - KEMT FEI TUKE
CANoe DENoe - KEMT FEI TUKE

Create successful ePaper yourself
Turn your PDF publications into a flip-book with our unique Google optimized e-Paper software.
100<br />
3.4 Graphic Window<br />
The Graphics windows serve to display signal responses over time. As was the case<br />
for the Data block, if a symbolic database is used you can have the values of signals<br />
specified there displayed directly as physical variables. For example, the engine<br />
speed response could be viewed in units of RPM or the temperature pattern over<br />
time could be viewed in degrees Celsius.<br />
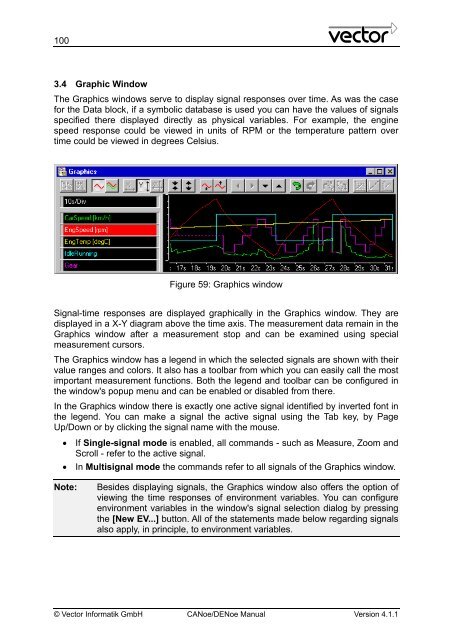
Figure 59: Graphics window<br />
Signal-time responses are displayed graphically in the Graphics window. They are<br />
displayed in a X-Y diagram above the time axis. The measurement data remain in the<br />
Graphics window after a measurement stop and can be examined using special<br />
measurement cursors.<br />
The Graphics window has a legend in which the selected signals are shown with their<br />
value ranges and colors. It also has a toolbar from which you can easily call the most<br />
important measurement functions. Both the legend and toolbar can be configured in<br />
the window's popup menu and can be enabled or disabled from there.<br />
In the Graphics window there is exactly one active signal identified by inverted font in<br />
the legend. You can make a signal the active signal using the Tab key, by Page<br />
Up/Down or by clicking the signal name with the mouse.<br />
• If Single-signal mode is enabled, all commands - such as Measure, Zoom and<br />
Scroll - refer to the active signal.<br />
• In Multisignal mode the commands refer to all signals of the Graphics window.<br />
Note: Besides displaying signals, the Graphics window also offers the option of<br />
viewing the time responses of environment variables. You can configure<br />
environment variables in the window's signal selection dialog by pressing<br />
the [New EV...] button. All of the statements made below regarding signals<br />
also apply, in principle, to environment variables.<br />
© Vector Informatik GmbH <strong>CANoe</strong>/<strong>DENoe</strong> Manual Version 4.1.1