CANoe DENoe - KEMT FEI TUKE
CANoe DENoe - KEMT FEI TUKE
CANoe DENoe - KEMT FEI TUKE

Create successful ePaper yourself
Turn your PDF publications into a flip-book with our unique Google optimized e-Paper software.
22<br />
This corresponds to the five values that you entered in the generator block as part of<br />
task 2. The values remain in the Graphics window after the end of the measurement.<br />
The measurement functions that the window provides for post-analysis are described<br />
in section 3.4.5.<br />
1.3.8 Use of the Database in Transmitting Messages<br />
Until now you have only used the symbolic database to observe signal values. However,<br />
the application capabilities reach well beyond this. For example, open the<br />
transmit list of the generator block of task 1. Instead of the identifier that you previously<br />
entered in the transmit list (64), you will now recognize the associated symbolic<br />
name in the first column. In fact, you can now enter a message directly from the database<br />
using the [Symbol...] button, without having to work with the identifier.<br />
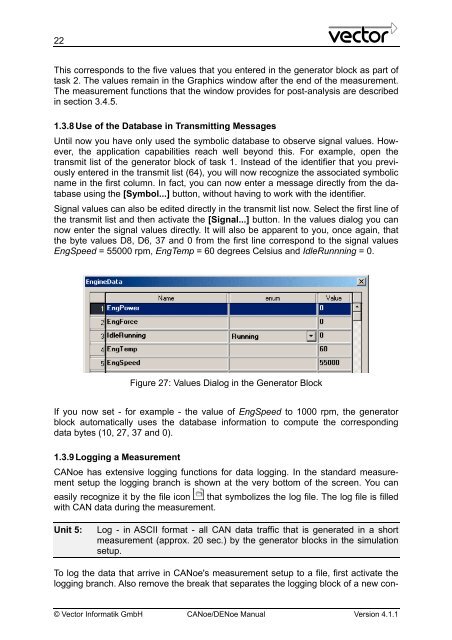
Signal values can also be edited directly in the transmit list now. Select the first line of<br />
the transmit list and then activate the [Signal...] button. In the values dialog you can<br />
now enter the signal values directly. It will also be apparent to you, once again, that<br />
the byte values D8, D6, 37 and 0 from the first line correspond to the signal values<br />
EngSpeed = 55000 rpm, EngTemp = 60 degrees Celsius and IdleRunnning = 0.<br />
Figure 27: Values Dialog in the Generator Block<br />
If you now set - for example - the value of EngSpeed to 1000 rpm, the generator<br />
block automatically uses the database information to compute the corresponding<br />
data bytes (10, 27, 37 and 0).<br />
1.3.9 Logging a Measurement<br />
<strong>CANoe</strong> has extensive logging functions for data logging. In the standard measurement<br />
setup the logging branch is shown at the very bottom of the screen. You can<br />
easily recognize it by the file icon that symbolizes the log file. The log file is filled<br />
with CAN data during the measurement.<br />
Unit 5: Log - in ASCII format - all CAN data traffic that is generated in a short<br />
measurement (approx. 20 sec.) by the generator blocks in the simulation<br />
setup.<br />
To log the data that arrive in <strong>CANoe</strong>'s measurement setup to a file, first activate the<br />
logging branch. Also remove the break that separates the logging block of a new con-<br />
© Vector Informatik GmbH <strong>CANoe</strong>/<strong>DENoe</strong> Manual Version 4.1.1