CANoe DENoe - KEMT FEI TUKE
CANoe DENoe - KEMT FEI TUKE
CANoe DENoe - KEMT FEI TUKE

You also want an ePaper? Increase the reach of your titles
YUMPU automatically turns print PDFs into web optimized ePapers that Google loves.
116<br />
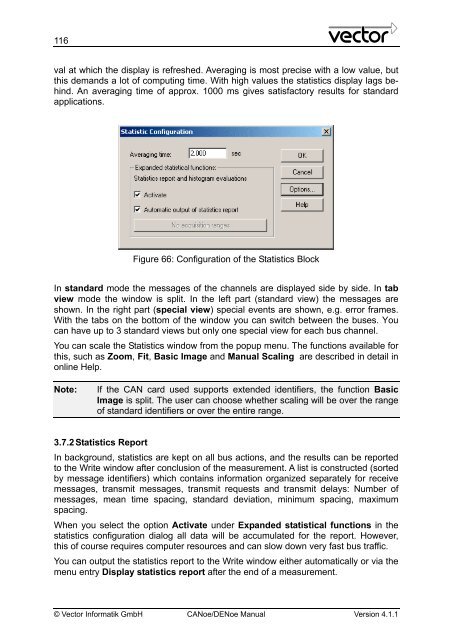
val at which the display is refreshed. Averaging is most precise with a low value, but<br />
this demands a lot of computing time. With high values the statistics display lags behind.<br />
An averaging time of approx. 1000 ms gives satisfactory results for standard<br />
applications.<br />
Figure 66: Configuration of the Statistics Block<br />
In standard mode the messages of the channels are displayed side by side. In tab<br />
view mode the window is split. In the left part (standard view) the messages are<br />
shown. In the right part (special view) special events are shown, e.g. error frames.<br />
With the tabs on the bottom of the window you can switch between the buses. You<br />
can have up to 3 standard views but only one special view for each bus channel.<br />
You can scale the Statistics window from the popup menu. The functions available for<br />
this, such as Zoom, Fit, Basic Image and Manual Scaling are described in detail in<br />
online Help.<br />
Note: If the CAN card used supports extended identifiers, the function Basic<br />
Image is split. The user can choose whether scaling will be over the range<br />
of standard identifiers or over the entire range.<br />
3.7.2 Statistics Report<br />
In background, statistics are kept on all bus actions, and the results can be reported<br />
to the Write window after conclusion of the measurement. A list is constructed (sorted<br />
by message identifiers) which contains information organized separately for receive<br />
messages, transmit messages, transmit requests and transmit delays: Number of<br />
messages, mean time spacing, standard deviation, minimum spacing, maximum<br />
spacing.<br />
When you select the option Activate under Expanded statistical functions in the<br />
statistics configuration dialog all data will be accumulated for the report. However,<br />
this of course requires computer resources and can slow down very fast bus traffic.<br />
You can output the statistics report to the Write window either automatically or via the<br />
menu entry Display statistics report after the end of a measurement.<br />
© Vector Informatik GmbH <strong>CANoe</strong>/<strong>DENoe</strong> Manual Version 4.1.1