Proceedings zur 6. Fachtagung BIOMET - Deutsche ...
Proceedings zur 6. Fachtagung BIOMET - Deutsche ...
Proceedings zur 6. Fachtagung BIOMET - Deutsche ...

Sie wollen auch ein ePaper? Erhöhen Sie die Reichweite Ihrer Titel.
YUMPU macht aus Druck-PDFs automatisch weboptimierte ePaper, die Google liebt.
Sap Flux Density / ET pot [-]<br />
1000<br />
800<br />
600<br />
400<br />
200<br />
Ash, DBH > 0.4 m<br />
Ash, DBH 0.2 - 0.4 m<br />
0<br />
0 10 20 30 40 50 60 70<br />
Distance from Forest Edge [m]<br />
120<br />
300<br />
250<br />
200<br />
150<br />
100<br />
50<br />
Oak, DBH > 0.6 m<br />
Oak, DBH < 0.6 m<br />
0<br />
0 10 20 30 40 50 60 70<br />
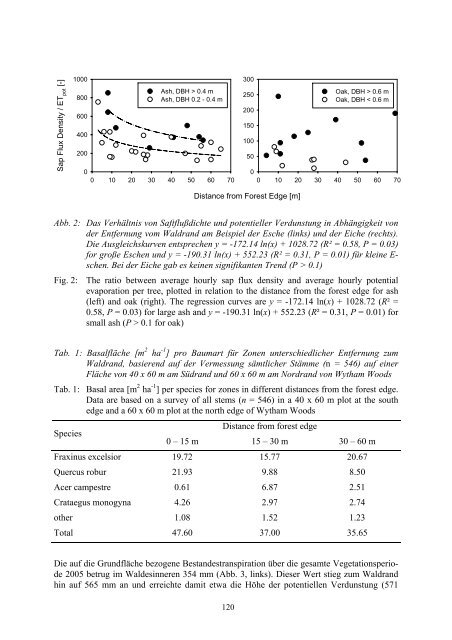
Abb. 2: Das Verhältnis von Saftflußdichte und potentieller Verdunstung in Abhängigkeit von<br />
der Entfernung vom Waldrand am Beispiel der Esche (links) und der Eiche (rechts).<br />
Die Ausgleichskurven entsprechen y = -172.14 ln(x) + 1028.72 (R² = 0.58, P = 0.03)<br />
for große Eschen und y = -190.31 ln(x) + 552.23 (R² = 0.31, P = 0.01) für kleine Eschen.<br />
Bei der Eiche gab es keinen signifikanten Trend (P > 0.1)<br />
Fig. 2: The ratio between average hourly sap flux density and average hourly potential<br />
evaporation per tree, plotted in relation to the distance from the forest edge for ash<br />
(left) and oak (right). The regression curves are y = -172.14 ln(x) + 1028.72 (R² =<br />
0.58, P = 0.03) for large ash and y = -190.31 ln(x) + 552.23 (R² = 0.31, P = 0.01) for<br />
small ash (P > 0.1 for oak)<br />
Tab. 1: Basalfläche [m 2 ha -1 ] pro Baumart für Zonen unterschiedlicher Entfernung zum<br />
Waldrand, basierend auf der Vermessung sämtlicher Stämme (n = 546) auf einer<br />
Fläche von 40 x 60 m am Südrand und 60 x 60 m am Nordrand von Wytham Woods<br />
Tab. 1: Basal area [m 2 ha -1 ] per species for zones in different distances from the forest edge.<br />
Data are based on a survey of all stems (n = 546) in a 40 x 60 m plot at the south<br />
edge and a 60 x 60 m plot at the north edge of Wytham Woods<br />
Species<br />
0 – 15 m<br />
Distance from forest edge<br />
15 – 30 m 30 – 60 m<br />
Fraxinus excelsior 19.72 15.77 20.67<br />
Quercus robur 21.93 9.88 8.50<br />
Acer campestre 0.61 <strong>6.</strong>87 2.51<br />
Crataegus monogyna 4.26 2.97 2.74<br />
other 1.08 1.52 1.23<br />
Total 47.60 37.00 35.65<br />
Die auf die Grundfläche bezogene Bestandestranspiration über die gesamte Vegetationsperiode<br />
2005 betrug im Waldesinneren 354 mm (Abb. 3, links). Dieser Wert stieg zum Waldrand<br />
hin auf 565 mm an und erreichte damit etwa die Höhe der potentiellen Verdunstung (571