Proceedings zur 6. Fachtagung BIOMET - Deutsche ...
Proceedings zur 6. Fachtagung BIOMET - Deutsche ...
Proceedings zur 6. Fachtagung BIOMET - Deutsche ...

Erfolgreiche ePaper selbst erstellen
Machen Sie aus Ihren PDF Publikationen ein blätterbares Flipbook mit unserer einzigartigen Google optimierten e-Paper Software.
In order to quantify the short time or inter annual adaptation of humans to the thermal component<br />
of the climate, the following analysis was carried out. A two fold Gaussian filter of 41<br />
days, which corresponds to a filter of 81 days was applied. This one side filter has 30 significant<br />
filter weights (SCHÖNWIESE, 1992), which is in accordance of a time frame, where<br />
physiological changes are still active concerning the heat effect on humans. The 41 days filter<br />
represent the variable part (short time adaptation) the daily PET and daily Tamin values have<br />
been applied. The PET values represent the upper limit of the thermal perception and the<br />
daily minimum temperature the lower limit. The adapted values PETa and Tamin have been<br />
calculated using the following formula.<br />
PETa = limit + (PETgauss – limit)*1/3 with limit of PET=30 °C and PET=35 °C.<br />
Tamina = limit + (Tamingauss – limit)*1/3 with limit of Tamin=18 °C and Tamin = 20<br />
°C.<br />
where, PETa is the PET value with short time adaptation, PETgauss is the PET with Gaussian<br />
filter and limit is the upper of the PET limit. Tamin is the Tamin value with short time adaptation,<br />
Tamingauss the Tamin with Gaussian filter and limit the upper of the Tamin limit.<br />
The formula expresses the constant part of thermal stress and a variable part which represents<br />
the short time thermal adaptation<br />
3 Results<br />
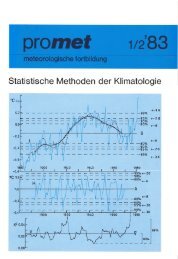
Figure 1 illustrates the variability of the daily PET values, the Gaussian filtered PET-values<br />
PETgauss, the PET for a limit of 35 °C (PET30) and 35 °C (PET35), for 1996 to 2005 in Vienna.<br />
The courses of PET30 and PET35 showed that there is a pattern, which describes the<br />
variability of the thermal adaptation. It can also be described as a memory of thermal perception<br />
or heat stress of humans.<br />
Besides, the inter annual variability of the daily Tamin values, the Gaussian filtered Taminvalues<br />
Tamingauss, the Tamin for a limit of 20 °C (Tamin20) and 18 °C (Tamin18) for 1996<br />
to 2005 in Vienna are presented in Figure 2. The courses of Tamin20 and Tamin18 are similar<br />
to those of PET30 and Heatwave35 of Figure 1.<br />
In Figure 3 the variability of the values of PET for 14 CET and Tamin and the amount of<br />
deaths caused by cardiovascular diseases (with a ten day sum) is illustrated. Respectively, in<br />
Figure 4 are illustrated the mortality data again with the by Gaussian filtered data of PET for<br />
the limit value of 35 °C and for Tamin of 20 °C.<br />
From the mortality data it can be extracted that during the summer period (May to September),<br />
during days with thermal load, the values of mortality are varying from 37 to 48 % of<br />
the annual mortality. The female mortality is all the year higher and during the summer again<br />
higher (up to 2 %). Looking on Fig. 3 and 4 in a first view the data of mortality and bioclimate,<br />
seem to be not directly correlated.. Even the extreme hot summer 2003 does not illustrate<br />
a relation between heat load and mortality. The pictures changes if one analyses the data<br />
based only the days over the threshold of Tamin>18 and PET > 35 °C and the mortality of<br />
these days or episodes (Table 1).<br />
26