Proceedings of the 3rd European Conference on Intellectual Capital
Proceedings of the 3rd European Conference on Intellectual Capital
Proceedings of the 3rd European Conference on Intellectual Capital

Create successful ePaper yourself
Turn your PDF publications into a flip-book with our unique Google optimized e-Paper software.
Nicolae Al. Pop et al.<br />
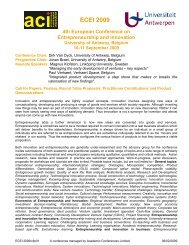
<str<strong>on</strong>g>the</str<strong>on</strong>g> studies at <str<strong>on</strong>g>the</str<strong>on</strong>g> same university or <str<strong>on</strong>g>the</str<strong>on</strong>g> recommendati<strong>on</strong> potential. In fig. 1 we can observe <str<strong>on</strong>g>the</str<strong>on</strong>g><br />
absolute satisfacti<strong>on</strong> <str<strong>on</strong>g>of</str<strong>on</strong>g> <str<strong>on</strong>g>the</str<strong>on</strong>g>se items, <strong>on</strong> a scale from 1 to 7, where 7 means very satisfied and 1<br />
means totally dissatisfied.<br />
5.2<br />
5<br />
4.8<br />
4.6<br />
4.4<br />
4.2<br />
4<br />
3.8<br />
Competences<br />
5.06<br />
Teaching Style<br />
4.4<br />
Pedagogical Skills<br />
4.67<br />
Implicati<strong>on</strong><br />
4.38<br />
Satisfacti<strong>on</strong><br />
Attitude<br />
4.42<br />
Communicati<strong>on</strong><br />
4.24<br />
Availability<br />
Figure 1: Satisfacti<strong>on</strong> with <str<strong>on</strong>g>the</str<strong>on</strong>g> competences <str<strong>on</strong>g>of</str<strong>on</strong>g> <str<strong>on</strong>g>the</str<strong>on</strong>g> pr<str<strong>on</strong>g>of</str<strong>on</strong>g>essors at a university (<strong>on</strong> a scale <str<strong>on</strong>g>of</str<strong>on</strong>g> 1 to 7,<br />
where 7=very satisfied and 1=totally dissatisfied)<br />
As we can observe in fig. 1 <str<strong>on</strong>g>the</str<strong>on</strong>g> satisfacti<strong>on</strong> <str<strong>on</strong>g>of</str<strong>on</strong>g> <str<strong>on</strong>g>the</str<strong>on</strong>g> students with <str<strong>on</strong>g>the</str<strong>on</strong>g> competences <str<strong>on</strong>g>of</str<strong>on</strong>g> <str<strong>on</strong>g>the</str<strong>on</strong>g> pr<str<strong>on</strong>g>of</str<strong>on</strong>g>essors<br />
have values between 4 (average satisfacti<strong>on</strong>) and 5 (ra<str<strong>on</strong>g>the</str<strong>on</strong>g>r satisfied). Although <str<strong>on</strong>g>the</str<strong>on</strong>g>re is no high<br />
variati<strong>on</strong> between <str<strong>on</strong>g>the</str<strong>on</strong>g> items, we can observe that <str<strong>on</strong>g>the</str<strong>on</strong>g> students are most satisfied with <str<strong>on</strong>g>the</str<strong>on</strong>g><br />
competences <str<strong>on</strong>g>of</str<strong>on</strong>g> <str<strong>on</strong>g>the</str<strong>on</strong>g> pr<str<strong>on</strong>g>of</str<strong>on</strong>g>essors (5.06) and with <str<strong>on</strong>g>the</str<strong>on</strong>g> pedagogical skills (4.67) and least satisfied with<br />
<str<strong>on</strong>g>the</str<strong>on</strong>g> communicati<strong>on</strong> between <str<strong>on</strong>g>the</str<strong>on</strong>g> pr<str<strong>on</strong>g>of</str<strong>on</strong>g>essors and <str<strong>on</strong>g>the</str<strong>on</strong>g> students (4.24) and <str<strong>on</strong>g>the</str<strong>on</strong>g> availability <str<strong>on</strong>g>of</str<strong>on</strong>g> pr<str<strong>on</strong>g>of</str<strong>on</strong>g>essors<br />
for discussi<strong>on</strong>s (4.32). The values presented corresp<strong>on</strong>d to <str<strong>on</strong>g>the</str<strong>on</strong>g> average item “satisfied that you chose<br />
this university”, which has a value <str<strong>on</strong>g>of</str<strong>on</strong>g> 4.83. It is interesting to observe that <str<strong>on</strong>g>the</str<strong>on</strong>g> value <str<strong>on</strong>g>of</str<strong>on</strong>g> this item, asked<br />
at <str<strong>on</strong>g>the</str<strong>on</strong>g> end <str<strong>on</strong>g>of</str<strong>on</strong>g> <str<strong>on</strong>g>the</str<strong>on</strong>g> questi<strong>on</strong>naire is higher than <str<strong>on</strong>g>the</str<strong>on</strong>g> overall satisfacti<strong>on</strong>, asked at <str<strong>on</strong>g>the</str<strong>on</strong>g> beginning <str<strong>on</strong>g>of</str<strong>on</strong>g> <str<strong>on</strong>g>the</str<strong>on</strong>g><br />
questi<strong>on</strong>naire, which has a value <str<strong>on</strong>g>of</str<strong>on</strong>g> 3.16. This indicates that <str<strong>on</strong>g>the</str<strong>on</strong>g> cognitive satisfacti<strong>on</strong> (after taking in<br />
c<strong>on</strong>siderati<strong>on</strong> all aspects regarding <str<strong>on</strong>g>the</str<strong>on</strong>g> university) is higher than <str<strong>on</strong>g>the</str<strong>on</strong>g> emoti<strong>on</strong>al satisfacti<strong>on</strong> (a value<br />
given, without taking in c<strong>on</strong>siderati<strong>on</strong> all items). The university should take this result in c<strong>on</strong>siderati<strong>on</strong><br />
and improve its image by marketing more several positive aspects. Because <str<strong>on</strong>g>of</str<strong>on</strong>g> this result we will take<br />
in c<strong>on</strong>siderati<strong>on</strong> in <str<strong>on</strong>g>the</str<strong>on</strong>g> fur<str<strong>on</strong>g>the</str<strong>on</strong>g>r analysis <str<strong>on</strong>g>the</str<strong>on</strong>g> item “satisfied that you chose this university”.<br />
In order to see <str<strong>on</strong>g>the</str<strong>on</strong>g> influence <str<strong>on</strong>g>of</str<strong>on</strong>g> all <str<strong>on</strong>g>the</str<strong>on</strong>g>se factors <strong>on</strong> <str<strong>on</strong>g>the</str<strong>on</strong>g> satisfacti<strong>on</strong> with <str<strong>on</strong>g>the</str<strong>on</strong>g> university, we have d<strong>on</strong>e a<br />
regressi<strong>on</strong> analysis with <str<strong>on</strong>g>the</str<strong>on</strong>g> help <str<strong>on</strong>g>of</str<strong>on</strong>g> <str<strong>on</strong>g>the</str<strong>on</strong>g> SPSS. In this analysis we had as dependent variable <str<strong>on</strong>g>the</str<strong>on</strong>g> item<br />
“satisfied that you chose this university” and <str<strong>on</strong>g>the</str<strong>on</strong>g> independent variables <str<strong>on</strong>g>the</str<strong>on</strong>g> items presented in fig. 1.<br />
The results <str<strong>on</strong>g>of</str<strong>on</strong>g> <str<strong>on</strong>g>the</str<strong>on</strong>g> regressi<strong>on</strong> analysis are presented in fig. 2.<br />
According to <str<strong>on</strong>g>the</str<strong>on</strong>g> value <str<strong>on</strong>g>of</str<strong>on</strong>g> <str<strong>on</strong>g>the</str<strong>on</strong>g> R-Square obtained in <str<strong>on</strong>g>the</str<strong>on</strong>g> regressi<strong>on</strong> analysis we can state that 26% <str<strong>on</strong>g>of</str<strong>on</strong>g><br />
<str<strong>on</strong>g>the</str<strong>on</strong>g> dependent variable can be explained by <str<strong>on</strong>g>the</str<strong>on</strong>g> analyzed factors. Although at <str<strong>on</strong>g>the</str<strong>on</strong>g> first glance this<br />
value is not very high, if we take in c<strong>on</strong>siderati<strong>on</strong> <str<strong>on</strong>g>the</str<strong>on</strong>g> fact that in <str<strong>on</strong>g>the</str<strong>on</strong>g> study, <str<strong>on</strong>g>the</str<strong>on</strong>g>re have been<br />
c<strong>on</strong>sidered 80 satisfacti<strong>on</strong> items, this value is a significant <strong>on</strong>e. This value is also c<strong>on</strong>firmed by <str<strong>on</strong>g>the</str<strong>on</strong>g> R-<br />
Square change. Also <str<strong>on</strong>g>the</str<strong>on</strong>g> F-Test in <str<strong>on</strong>g>the</str<strong>on</strong>g> ANOVA Table shows a significance <str<strong>on</strong>g>of</str<strong>on</strong>g> <str<strong>on</strong>g>the</str<strong>on</strong>g> regressi<strong>on</strong> <str<strong>on</strong>g>of</str<strong>on</strong>g> 99%.<br />
According to <str<strong>on</strong>g>the</str<strong>on</strong>g> results <str<strong>on</strong>g>of</str<strong>on</strong>g> <str<strong>on</strong>g>the</str<strong>on</strong>g> Regressi<strong>on</strong> analysis and assuming that all o<str<strong>on</strong>g>the</str<strong>on</strong>g>r factors are c<strong>on</strong>stant<br />
we have <str<strong>on</strong>g>the</str<strong>on</strong>g> following regressi<strong>on</strong> functi<strong>on</strong>:<br />
Satisfacti<strong>on</strong> = 1.66 + 0.21*competences + 0.12*teaching_style – 0.28*pedagogical_skills +<br />
0.12*implicati<strong>on</strong> + 0.03*attitude + 0.12*communicati<strong>on</strong> + 0.08*availability<br />
So we can observe that <str<strong>on</strong>g>the</str<strong>on</strong>g> highest influence <strong>on</strong> <str<strong>on</strong>g>the</str<strong>on</strong>g> overall satisfacti<strong>on</strong> has <str<strong>on</strong>g>the</str<strong>on</strong>g> competences <str<strong>on</strong>g>of</str<strong>on</strong>g> <str<strong>on</strong>g>the</str<strong>on</strong>g><br />
pr<str<strong>on</strong>g>of</str<strong>on</strong>g>essors and <str<strong>on</strong>g>the</str<strong>on</strong>g> least influence has <str<strong>on</strong>g>the</str<strong>on</strong>g> attitude <str<strong>on</strong>g>of</str<strong>on</strong>g> <str<strong>on</strong>g>the</str<strong>on</strong>g> pr<str<strong>on</strong>g>of</str<strong>on</strong>g>essors towards <str<strong>on</strong>g>the</str<strong>on</strong>g> students. The next<br />
highest influence has <str<strong>on</strong>g>the</str<strong>on</strong>g> teaching style, <str<strong>on</strong>g>the</str<strong>on</strong>g> implicati<strong>on</strong> and <str<strong>on</strong>g>the</str<strong>on</strong>g> communicati<strong>on</strong> <str<strong>on</strong>g>of</str<strong>on</strong>g> <str<strong>on</strong>g>the</str<strong>on</strong>g> pr<str<strong>on</strong>g>of</str<strong>on</strong>g>essors<br />
towards <str<strong>on</strong>g>the</str<strong>on</strong>g> students. The BETA-test in <str<strong>on</strong>g>the</str<strong>on</strong>g> SPSS analysis shows also <str<strong>on</strong>g>the</str<strong>on</strong>g> highest influence for <str<strong>on</strong>g>the</str<strong>on</strong>g><br />
item competences <str<strong>on</strong>g>of</str<strong>on</strong>g> pr<str<strong>on</strong>g>of</str<strong>on</strong>g>essors. With <str<strong>on</strong>g>the</str<strong>on</strong>g> excepti<strong>on</strong> <str<strong>on</strong>g>of</str<strong>on</strong>g> <str<strong>on</strong>g>the</str<strong>on</strong>g> items “pedagogical skills” and “attitude”, for<br />
all o<str<strong>on</strong>g>the</str<strong>on</strong>g>r factors <str<strong>on</strong>g>the</str<strong>on</strong>g> significance has a value close to “0” so that we can reject <str<strong>on</strong>g>the</str<strong>on</strong>g> Zero-Hypo<str<strong>on</strong>g>the</str<strong>on</strong>g>sis.<br />
346<br />
4.32