- Page 1 and 2:
March 31, 2011 British Columbia Uti
- Page 3 and 4:
March 31, 2011 British Columbia Uti
- Page 5 and 6:
FORTISBC ENERGY INC. AND FORTISBC E
- Page 7 and 8:
FORTISBC ENERGY INC. AND FORTISBC E
- Page 9 and 10:
FORTISBC ENERGY INC. AND FORTISBC E
- Page 11 and 12:
FORTISBC ENERGY INC. AND FORTISBC E
- Page 13 and 14:
FORTISBC ENERGY INC. AND FORTISBC E
- Page 15 and 16:
FORTISBC ENERGY INC. AND FORTISBC E
- Page 17 and 18:
FORTISBC ENERGY INC. AND FORTISBC E
- Page 19 and 20:
FORTISBC ENERGY INC. AND FORTISBC E
- Page 21 and 22:
FORTISBC ENERGY INC. AND FORTISBC E
- Page 23 and 24:
FORTISBC ENERGY INC. AND FORTISBC E
- Page 25 and 26:
FORTISBC ENERGY INC. AND FORTISBC E
- Page 27 and 28:
FORTISBC ENERGY INC. AND FORTISBC E
- Page 29 and 30:
FORTISBC ENERGY INC. AND FORTISBC E
- Page 31 and 32:
FORTISBC ENERGY INC. AND FORTISBC E
- Page 33 and 34:
FORTISBC ENERGY INC. AND FORTISBC E
- Page 35 and 36:
FORTISBC ENERGY INC. AND FORTISBC E
- Page 37 and 38:
FORTISBC ENERGY INC. AND FORTISBC E
- Page 39 and 40:
FORTISBC ENERGY INC. AND FORTISBC E
- Page 41 and 42:
FORTISBC ENERGY INC. AND FORTISBC E
- Page 43 and 44:
FORTISBC ENERGY INC. AND FORTISBC E
- Page 45 and 46:
FORTISBC ENERGY INC. AND FORTISBC E
- Page 47 and 48:
FORTISBC ENERGY INC. AND FORTISBC E
- Page 49 and 50:
FORTISBC ENERGY INC. AND FORTISBC E
- Page 51 and 52:
FORTISBC ENERGY INC. AND FORTISBC E
- Page 53 and 54:
FORTISBC ENERGY INC. AND FORTISBC E
- Page 55 and 56:
FORTISBC ENERGY INC. AND FORTISBC E
- Page 57 and 58:
FORTISBC ENERGY INC. AND FORTISBC E
- Page 59 and 60:
FORTISBC ENERGY INC. AND FORTISBC E
- Page 61 and 62:
FORTISBC ENERGY INC. AND FORTISBC E
- Page 63 and 64:
FORTISBC ENERGY INC. AND FORTISBC E
- Page 65 and 66:
FORTISBC ENERGY INC. AND FORTISBC E
- Page 67 and 68:
FORTISBC ENERGY INC. AND FORTISBC E
- Page 69 and 70:
FORTISBC ENERGY INC. AND FORTISBC E
- Page 71 and 72:
FORTISBC ENERGY INC. AND FORTISBC E
- Page 73 and 74:
FORTISBC ENERGY INC. AND FORTISBC E
- Page 75 and 76:
FORTISBC ENERGY INC. AND FORTISBC E
- Page 77 and 78:
FORTISBC ENERGY INC. AND FORTISBC E
- Page 79 and 80:
FORTISBC ENERGY INC. AND FORTISBC E
- Page 81 and 82:
FORTISBC ENERGY INC. AND FORTISBC E
- Page 83 and 84:
FORTISBC ENERGY INC. AND FORTISBC E
- Page 85 and 86:
FORTISBC ENERGY INC. AND FORTISBC E
- Page 87 and 88:
FORTISBC ENERGY INC. AND FORTISBC E
- Page 89 and 90:
FORTISBC ENERGY INC. AND FORTISBC E
- Page 91 and 92:
FORTISBC ENERGY INC. AND FORTISBC E
- Page 93 and 94:
FORTISBC ENERGY INC. AND FORTISBC E
- Page 95 and 96:
FORTISBC ENERGY INC. AND FORTISBC E
- Page 97 and 98:
FORTISBC ENERGY INC. AND FORTISBC E
- Page 99 and 100:
FORTISBC ENERGY INC. AND FORTISBC E
- Page 101 and 102:
FORTISBC ENERGY INC. AND FORTISBC E
- Page 103 and 104:
FORTISBC ENERGY INC. AND FORTISBC E
- Page 105 and 106:
FORTISBC ENERGY INC. AND FORTISBC E
- Page 107 and 108:
FORTISBC ENERGY INC. AND FORTISBC E
- Page 109 and 110:
FORTISBC ENERGY INC. AND FORTISBC E
- Page 111 and 112:
FORTISBC ENERGY INC. AND FORTISBC E
- Page 113 and 114:
FORTISBC ENERGY INC. AND FORTISBC E
- Page 115 and 116:
FORTISBC ENERGY INC. AND FORTISBC E
- Page 117 and 118:
FORTISBC ENERGY INC. AND FORTISBC E
- Page 119 and 120:
FORTISBC ENERGY INC. AND FORTISBC E
- Page 121 and 122:
FORTISBC ENERGY INC. AND FORTISBC E
- Page 123 and 124:
FORTISBC ENERGY INC. AND FORTISBC E
- Page 125 and 126:
FORTISBC ENERGY INC. AND FORTISBC E
- Page 127 and 128:
FORTISBC ENERGY INC. AND FORTISBC E
- Page 129 and 130:
FORTISBC ENERGY INC. AND FORTISBC E
- Page 131 and 132:
FORTISBC ENERGY INC. AND FORTISBC E
- Page 133 and 134:
FORTISBC ENERGY INC. AND FORTISBC E
- Page 135 and 136:
FORTISBC ENERGY INC. AND FORTISBC E
- Page 137 and 138:
FORTISBC ENERGY INC. AND FORTISBC E
- Page 139 and 140:
FORTISBC ENERGY INC. AND FORTISBC E
- Page 141 and 142:
FORTISBC ENERGY INC. AND FORTISBC E
- Page 143 and 144:
FORTISBC ENERGY INC. AND FORTISBC E
- Page 145 and 146:
FORTISBC ENERGY INC. AND FORTISBC E
- Page 147 and 148:
FORTISBC ENERGY INC. AND FORTISBC E
- Page 149 and 150:
FORTISBC ENERGY INC. AND FORTISBC E
- Page 151 and 152:
FORTISBC ENERGY INC. AND FORTISBC E
- Page 153 and 154:
FORTISBC ENERGY INC. AND FORTISBC E
- Page 155 and 156:
FORTISBC ENERGY INC. AND FORTISBC E
- Page 157 and 158:
FORTISBC ENERGY INC. AND FORTISBC E
- Page 159 and 160:
FORTISBC ENERGY INC. AND FORTISBC E
- Page 161 and 162:
FORTISBC ENERGY INC. AND FORTISBC E
- Page 163 and 164:
FORTISBC ENERGY INC. AND FORTISBC E
- Page 165 and 166:
FORTISBC ENERGY INC. AND FORTISBC E
- Page 167 and 168:
FORTISBC ENERGY INC. AND FORTISBC E
- Page 169 and 170:
FORTISBC ENERGY INC. AND FORTISBC E
- Page 171 and 172:
FORTISBC ENERGY INC. AND FORTISBC E
- Page 173 and 174:
FORTISBC ENERGY INC. AND FORTISBC E
- Page 175 and 176:
FORTISBC ENERGY INC. AND FORTISBC E
- Page 177 and 178:
FORTISBC ENERGY INC. AND FORTISBC E
- Page 179 and 180:
FORTISBC ENERGY INC. AND FORTISBC E
- Page 181 and 182:
FORTISBC ENERGY INC. AND FORTISBC E
- Page 183 and 184:
FORTISBC ENERGY INC. AND FORTISBC E
- Page 185 and 186:
FORTISBC ENERGY INC. AND FORTISBC E
- Page 187 and 188:
FORTISBC ENERGY INC. AND FORTISBC E
- Page 189 and 190:
FORTISBC ENERGY INC. AND FORTISBC E
- Page 191 and 192:
FORTISBC ENERGY INC. AND FORTISBC E
- Page 193 and 194:
FORTISBC ENERGY INC. AND FORTISBC E
- Page 195 and 196:
FORTISBC ENERGY INC. AND FORTISBC E
- Page 197 and 198:
FORTISBC ENERGY INC. AND FORTISBC E
- Page 199 and 200:
FORTISBC ENERGY INC. AND FORTISBC E
- Page 201 and 202:
FORTISBC ENERGY INC. AND FORTISBC E
- Page 203 and 204:
FORTISBC ENERGY INC. AND FORTISBC E
- Page 205 and 206:
FORTISBC ENERGY INC. AND FORTISBC E
- Page 207 and 208:
FORTISBC ENERGY INC. AND FORTISBC E
- Page 209 and 210:
FORTISBC ENERGY INC. AND FORTISBC E
- Page 211 and 212:
FORTISBC ENERGY INC. AND FORTISBC E
- Page 213 and 214:
FORTISBC ENERGY INC. AND FORTISBC E
- Page 215 and 216:
FORTISBC ENERGY INC. AND FORTISBC E
- Page 217 and 218:
FORTISBC ENERGY INC. AND FORTISBC E
- Page 219 and 220:
FORTISBC ENERGY INC. AND FORTISBC E
- Page 221 and 222:
FORTISBC ENERGY INC. AND FORTISBC E
- Page 223 and 224:
FORTISBC ENERGY INC. AND FORTISBC E
- Page 225 and 226:
FORTISBC ENERGY INC. AND FORTISBC E
- Page 227 and 228:
FORTISBC ENERGY INC. AND FORTISBC E
- Page 229 and 230:
FORTISBC ENERGY INC. AND FORTISBC E
- Page 231 and 232:
FORTISBC ENERGY INC. AND FORTISBC E
- Page 233 and 234:
FORTISBC ENERGY INC. AND FORTISBC E
- Page 235 and 236:
FORTISBC ENERGY INC. AND FORTISBC E
- Page 237 and 238:
FORTISBC ENERGY INC. AND FORTISBC E
- Page 239 and 240:
FORTISBC ENERGY INC. AND FORTISBC E
- Page 241 and 242:
FORTISBC ENERGY INC. AND FORTISBC E
- Page 243 and 244:
FORTISBC ENERGY INC. AND FORTISBC E
- Page 245 and 246:
FORTISBC ENERGY INC. AND FORTISBC E
- Page 247 and 248:
FORTISBC ENERGY INC. AND FORTISBC E
- Page 249 and 250:
FORTISBC ENERGY INC. AND FORTISBC E
- Page 251 and 252:
FORTISBC ENERGY INC. AND FORTISBC E
- Page 253 and 254:
FORTISBC ENERGY INC. AND FORTISBC E
- Page 255 and 256:
FORTISBC ENERGY INC. AND FORTISBC E
- Page 257 and 258:
FORTISBC ENERGY INC. AND FORTISBC E
- Page 259 and 260:
FORTISBC ENERGY INC. AND FORTISBC E
- Page 261 and 262:
FORTISBC ENERGY INC. AND FORTISBC E
- Page 263 and 264:
FORTISBC ENERGY INC. AND FORTISBC E
- Page 265 and 266:
FORTISBC ENERGY INC. AND FORTISBC E
- Page 267 and 268:
FORTISBC ENERGY INC. AND FORTISBC E
- Page 269 and 270:
FORTISBC ENERGY INC. AND FORTISBC E
- Page 271 and 272:
FORTISBC ENERGY INC. AND FORTISBC E
- Page 273 and 274:
FORTISBC ENERGY INC. AND FORTISBC E
- Page 275 and 276:
FORTISBC ENERGY INC. AND FORTISBC E
- Page 277 and 278:
FORTISBC ENERGY INC. AND FORTISBC E
- Page 279 and 280:
FORTISBC ENERGY INC. AND FORTISBC E
- Page 281 and 282:
Appendix A GLOSSARY OF TERMS
- Page 283 and 284:
FORTISBC ENERGY INC. AND FORTISBC E
- Page 285 and 286:
FORTISBC ENERGY INC. AND FORTISBC E
- Page 287 and 288:
FORTISBC ENERGY INC. AND FORTISBC E
- Page 289 and 290:
2010 DSM Actuals SAVINGS (GJ) Impac
- Page 291 and 292:
FORTIS BC VANCOUVER ISLAND 2010 FEV
- Page 293 and 294:
FORTIS BC 2010 FEI Programs Actuals
- Page 295 and 296:
FORTIS BC 2010 Residential Programs
- Page 297 and 298:
FORTIS BC 2010 Commercial Programs
- Page 299 and 300:
FORTIS BC 2010 Joint Initiatives Pr
- Page 301 and 302:
FORTIS BC 2010 Conservation for Aff
- Page 303 and 304:
FORTIS BC 2010 High Carbon Fuel Swi
- Page 305 and 306:
FORTIS BC 2010 High Carbon Fuel Swi
- Page 307 and 308:
2011 DSM Planned SAVINGS (GJ) Impac
- Page 309 and 310:
FORTIS BC VANCOUVER ISLAND 2011 FEV
- Page 311 and 312:
FORTIS BC COSTS ($000) 2011 DSM Pla
- Page 313 and 314:
FORTIS BC 2011 Residential Planned
- Page 315 and 316:
FORTIS BC 2011 Commercial Programs
- Page 317 and 318:
FORTIS BC 2011 Joint Initiatives Pl
- Page 319 and 320:
FORTIS BC 2011 Conservation for Aff
- Page 321 and 322:
FORTIS BC 2011 Innovative Technolog
- Page 323 and 324:
FORTIS BC 2011 High Carbon Fuel Swi
- Page 325:
Appendix C DSM REGULATION AND BCUC
- Page 332 and 333:
PART 5 — ENERGY EFFICIENCY MEASUR
- Page 334 and 335:
HER MAJESTY, by and with the advice
- Page 336 and 337:
(c) equipment and facilities that a
- Page 338 and 339:
Integrated resource plans (l) to fo
- Page 340 and 341:
services necessary to facilitate th
- Page 342 and 343:
Status report (2) In an order under
- Page 344 and 345:
prescribed circumstances and on the
- Page 346 and 347:
8 (1) In setting rates under the Ut
- Page 348 and 349:
(a) undertake a prohibited project,
- Page 350 and 351:
(ii) generates energy by means of a
- Page 352 and 353:
(5) The authority may, by itself, o
- Page 354 and 355:
"power project" means an electricit
- Page 356 and 357:
Transfer of property "right", in re
- Page 358 and 359:
(ii) execute any record required to
- Page 360 and 361:
Definitions be continued, by or aga
- Page 362 and 363:
29 (1) The transfer of a transferre
- Page 364 and 365:
(2) Despite section 36 (1) of the H
- Page 366 and 367:
08, that, under the Utilities Commi
- Page 368 and 369:
(i) respecting the authority's obli
- Page 370 and 371:
Regulations 36 (1) In making a regu
- Page 372 and 373:
Transition (a) prescribing classes
- Page 374 and 375:
(a) in subsection (1) (f) by striki
- Page 376 and 377:
(1.1) The authority's purposes are
- Page 378 and 379:
(a) any other provision of this Act
- Page 380 and 381:
eceive or may receive service from
- Page 382 and 383:
(b) an applicable integrated resour
- Page 384 and 385:
9 Section 73 July 5, 2010 Schedule
- Page 386 and 387:
(f) McGregor Lower Canyon; (g) Homa
- Page 388 and 389:
TABLE OF CONTENTS Page No. 1.0 BACK
- Page 390 and 391:
1.0 BACKGROUND AND REGULATORY PROCE
- Page 392 and 393:
1.2 Legal and Regulatory 3 1.2.1 Th
- Page 394 and 395:
1.2.4 BC Government’s Energy Obje
- Page 396 and 397:
7 Terasen also submits that the ene
- Page 398 and 399:
2.1.1.1 New Construction For new co
- Page 400 and 401:
TGI and TGVI Commercial Programs Ne
- Page 402 and 403:
13 Terasen states that commercial s
- Page 404 and 405:
New Construction 15 Table 5 Residen
- Page 406 and 407:
17 BC Hydro filed the evidence of R
- Page 408 and 409:
• Stakeholder industry group acti
- Page 410 and 411:
the CEO expenditures be redirected
- Page 412 and 413:
public outreach. (Exhibit B‐1, p.
- Page 414 and 415:
25 2.4.3 Innovative Technologies, N
- Page 416 and 417:
27 2.5 Conservation Potential Revie
- Page 418 and 419:
29 “The study findings confirm th
- Page 420 and 421:
31 3.0 ASSESSMENT CRITERIA AND ACCO
- Page 422 and 423:
Total Resource Cost Test Terasen pr
- Page 424 and 425:
3.2 Free Riders Terasen seeks certa
- Page 426 and 427:
Commission Determination 37 The Com
- Page 428 and 429:
“[a]ttribution of savings from co
- Page 430 and 431:
Tax was included in the participant
- Page 432 and 433:
43 4.0 CAPITALISATION OF INCREMENTA
- Page 434 and 435:
5.0 AMORTISATION OF EEC EXPENDITURE
- Page 436 and 437:
SIXTH FLOOR, 900 HOWE STREET, BOX 2
- Page 438 and 439:
5. The proposal to exclude the free
- Page 440 and 441:
Exhibit No. Description B‐2‐1 C
- Page 442 and 443:
Exhibit No. Description C4‐3 Lett
- Page 444 and 445:
Exhibit No. Description E‐13 CANA
- Page 446 and 447:
2 B RITISH COLUMBIA U TILITIES COMM
- Page 448 and 449:
APPENDIX A to Order G-140-09 Page 1
- Page 450 and 451:
November 13, 2009 British Columbia
- Page 452 and 453:
- 2 - CONFIDENTIAL NEGOTIATED SETTL
- Page 454 and 455:
- 4 - CONFIDENTIAL NEGOTIATED SETTL
- Page 456 and 457:
- 6 - CONFIDENTIAL NEGOTIATED SETTL
- Page 458 and 459:
- 8 - CONFIDENTIAL NEGOTIATED SETTL
- Page 460 and 461:
- 10 - CONFIDENTIAL NEGOTIATED SETT
- Page 462 and 463:
- 12 - CONFIDENTIAL NEGOTIATED SETT
- Page 464 and 465:
- 14 - CONFIDENTIAL NEGOTIATED SETT
- Page 466 and 467:
- 16 - CONFIDENTIAL NEGOTIATED SETT
- Page 468 and 469:
- 18 - CONFIDENTIAL NEGOTIATED SETT
- Page 470 and 471:
Schedule # Summary Schedules Core M
- Page 472 and 473:
CONFIDENTIAL AND WITHOUT PREJUDICE
- Page 474 and 475:
TERASEN GAS (VANCOUVER ISLAND) INC.
- Page 476 and 477:
TERASEN GAS (VANCOUVER ISLAND) INC.
- Page 478 and 479:
TERASEN GAS (VANCOUVER ISLAND) INC.
- Page 480 and 481:
TERASEN GAS (VANCOUVER ISLAND) INC.
- Page 482 and 483:
TERASEN GAS (VANCOUVER ISLAND) INC.
- Page 484 and 485:
TERASEN GAS (VANCOUVER ISLAND) INC.
- Page 486 and 487:
TERASEN GAS (VANCOUVER ISLAND) INC.
- Page 488 and 489:
TERASEN GAS (VANCOUVER ISLAND) INC.
- Page 490 and 491:
TERASEN GAS (VANCOUVER ISLAND) INC.
- Page 492 and 493:
TERASEN GAS (VANCOUVER ISLAND) INC.
- Page 494 and 495:
TERASEN GAS (VANCOUVER ISLAND) INC.
- Page 496 and 497:
TERASEN GAS (VANCOUVER ISLAND) INC.
- Page 498 and 499:
TERASEN GAS (VANCOUVER ISLAND) INC.
- Page 500 and 501:
TERASEN GAS (VANCOUVER ISLAND) INC.
- Page 502 and 503:
TERASEN GAS (VANCOUVER ISLAND) INC.
- Page 504 and 505:
TERASEN GAS (VANCOUVER ISLAND) INC.
- Page 506 and 507:
TERASEN GAS (VANCOUVER ISLAND) INC.
- Page 508 and 509:
TERASEN GAS (VANCOUVER ISLAND) INC.
- Page 510 and 511:
TERASEN GAS (VANCOUVER ISLAND) INC.
- Page 512 and 513:
TERASEN GAS (VANCOUVER ISLAND) INC.
- Page 514 and 515:
TERASEN GAS (VANCOUVER ISLAND) INC.
- Page 516 and 517:
TERASEN GAS (VANCOUVER ISLAND) INC.
- Page 518 and 519:
TERASEN GAS (VANCOUVER ISLAND) INC.
- Page 520 and 521:
TERASEN GAS (VANCOUVER ISLAND) INC.
- Page 522 and 523:
TERASEN GAS (VANCOUVER ISLAND) INC.
- Page 524 and 525:
TERASEN GAS (VANCOUVER ISLAND) INC.
- Page 526 and 527: TERASEN GAS (VANCOUVER ISLAND) INC.
- Page 528 and 529: TERASEN GAS (VANCOUVER ISLAND) INC.
- Page 530 and 531: TERASEN GAS (VANCOUVER ISLAND) INC.
- Page 532 and 533: TERASEN GAS (VANCOUVER ISLAND) INC.
- Page 534 and 535: TERASEN GAS (VANCOUVER ISLAND) INC.
- Page 536 and 537: TERASEN GAS (VANCOUVER ISLAND) INC.
- Page 538 and 539: TERASEN GAS (VANCOUVER ISLAND) INC.
- Page 540 and 541: TERASEN GAS (VANCOUVER ISLAND) INC.
- Page 542 and 543: TERASEN GAS (VANCOUVER ISLAND) INC.
- Page 544 and 545: TERASEN GAS (VANCOUVER ISLAND) INC.
- Page 546 and 547: APPENDIX A to Order G-140-09 Page 9
- Page 548 and 549: APPENDIX A to Order G-140-09 Page 1
- Page 550 and 551: SIXTH FLOOR, 900 HOWE STREET, BOX 2
- Page 552 and 553: APPENDIX A to Order G-141-09 Page 1
- Page 554 and 555: - 2 - CONFIDENTIAL NEGOTIATED SETTL
- Page 556 and 557: - 4 - CONFIDENTIAL NEGOTIATED SETTL
- Page 558 and 559: - 6 - CONFIDENTIAL NEGOTIATED SETTL
- Page 560 and 561: - 8 - CONFIDENTIAL NEGOTIATED SETTL
- Page 562 and 563: - 10 - CONFIDENTIAL NEGOTIATED SETT
- Page 564 and 565: 22. Depreciation Study - 12 - CONFI
- Page 566 and 567: - 14 - CONFIDENTIAL NEGOTIATED SETT
- Page 568 and 569: - 16 - CONFIDENTIAL NEGOTIATED SETT
- Page 570 and 571: - 18 - CONFIDENTIAL NEGOTIATED SETT
- Page 572 and 573: TERASEN GAS INC. 2010-2011 REVENUE
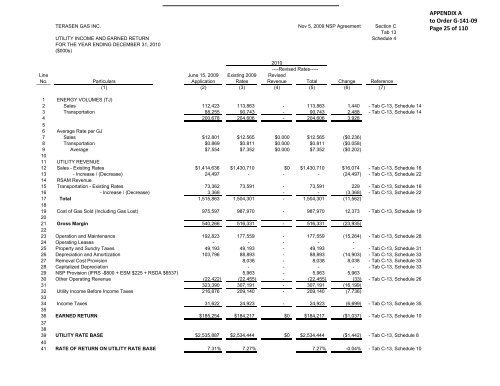
- Page 574 and 575: TERASEN GAS INC. Nov 5, 2009 NSP Ag
- Page 578 and 579: TERASEN GAS INC. Nov 5, 2009 NSP Ag
- Page 580 and 581: TERASEN GAS INC. Nov 5, 2009 NSP Ag
- Page 582 and 583: APPENDIX A to Order G-141-09 TERASE
- Page 584 and 585: TERASEN GAS INC. Nov 5, 2009 NSP Ag
- Page 586 and 587: TERASEN GAS INC. Nov 5, 2009 NSP Ag
- Page 588 and 589: TERASEN GAS INC. Nov 5, 2009 NSP Ag
- Page 590 and 591: TERASEN GAS INC. Nov 5, 2009 NSP Ag
- Page 592 and 593: TERASEN GAS INC. Nov 5, 2009 NSP Ag
- Page 594 and 595: TERASEN GAS INC. Nov 5, 2009 NSP Ag
- Page 596 and 597: TERASEN GAS INC. Nov 5, 2009 NSP Ag
- Page 598 and 599: TERASEN GAS INC. Nov 5, 2009 NSP Ag
- Page 600 and 601: TERASEN GAS INC Nov 5, 2009 NSP Agr
- Page 602 and 603: TERASEN GAS INC. Nov 5, 2009 NSP Ag
- Page 604 and 605: TERASEN GAS INC. Nov 5, 2009 NSP Ag
- Page 606 and 607: TERASEN GAS INC. Nov 5, 2009 NSP Ag
- Page 608 and 609: TERASEN GAS INC. Nov 5, 2009 NSP Ag
- Page 610 and 611: TERASEN GAS INC. Nov 5, 2009 NSP Ag
- Page 612 and 613: TERASEN GAS INC. Nov 5, 2009 NSP Ag
- Page 614 and 615: TERASEN GAS INC. Nov 5, 2009 NSP Ag
- Page 616 and 617: TERASEN GAS INC. Nov 5, 2009 NSP Ag
- Page 618 and 619: TERASEN GAS INC. Nov 5, 2009 NSP Ag
- Page 620 and 621: TERASEN GAS INC. Nov 5, 2009 NSP Ag
- Page 622 and 623: TERASEN GAS INC. Nov 5, 2009 NSP Ag
- Page 624 and 625: TERASEN GAS INC. Nov 5, 2009 NSP Ag
- Page 626 and 627:
TERASEN GAS INC. Nov 5, 2009 NSP Ag
- Page 628 and 629:
TERASEN GAS INC. Nov 5, 2009 NSP Ag
- Page 630 and 631:
APPENDIX A to Order G-141-09 TERASE
- Page 632 and 633:
APPENDIX A to Order G-141-09 TERASE
- Page 634 and 635:
TERASEN GAS INC. Nov 5, 2009 NSP Ag
- Page 636 and 637:
APPENDIX A to Order G-141-09 Page 8
- Page 638 and 639:
TERASEN GAS INC. Nov 5, 2009 NSP Ag
- Page 640 and 641:
TERASEN GAS INC. June 1, 2009 A Sec
- Page 642 and 643:
APPENDIX A to Order G-141-09 Page 9
- Page 644 and 645:
TERASEN GAS INC. June 1, 2009 A Sec
- Page 646 and 647:
TERASEN GAS INC. June 1, 2009 A Sec
- Page 648 and 649:
TERASEN GAS INC. August 17, 2009 Re
- Page 650 and 651:
The British Columbia Public Interes
- Page 652 and 653:
APPENDIX A to Order G-141-09 Page 1
- Page 654 and 655:
From: Nakoneshny, Philip BCUC:EX Se
- Page 656 and 657:
PHILIP W. NAKONESHNY DIRECTOR, RATE
- Page 658:
3 for approval of Rate Schedule 6 C
- Page 663 and 664:
B.C. EnErgy EffiCiEnCy ACt StAndArd
- Page 665 and 666:
B.C. EnErgy EffiCiEnCy ACt StAndArd
- Page 667 and 668:
Appendix E CONSERVATION EDUCATION A
- Page 669 and 670:
Event Location Residential Commerci
- Page 671 and 672:
Event Location Residential Commerci
- Page 673 and 674:
Event Location Residential Commerci
- Page 675 and 676:
School Location Program Brooke Elem
- Page 677 and 678:
School Location Program Conservatio
- Page 679 and 680:
School Location Program Hudson Road
- Page 681 and 682:
School Location Program Montecito E
- Page 683 and 684:
School Location Program Shawnigan L
- Page 685 and 686:
School Location Program Wiltse Elem
- Page 687 and 688:
March 22, 2011 Mr. Mark Grist, Fort
- Page 689 and 690:
the fact review processes enabled b
- Page 693 and 694:
March 23, 2011 Mark Grist Manager,
- Page 695 and 696:
Appendix G CONTRACTOR STUDY QUALITA
- Page 697 and 698:
2 Table Of Contents Background And
- Page 699 and 700:
4 Methodology METHODOLOGY Study par
- Page 701 and 702:
6 Summary Of Findings (2) Customers
- Page 703 and 704:
8 Awareness Of EE Incentive Program
- Page 705 and 706:
10 Barriers To Contractor Participa
- Page 707 and 708:
12 Communications Of Energy gy Effi
- Page 709 and 710:
14 Desirable Support Materials The
- Page 711 and 712:
Perspectives On Training And Upgrad
- Page 713 and 714:
18 Certification Very few indicate
- Page 716 and 717:
Appendix H EEC STAKEHOLDER GROUP
- Page 718 and 719:
Westbrook Relations Nina Winham New
- Page 720 and 721:
Attendees Terasen Gas Energy Effici
- Page 722 and 723:
Ministry policy on storage tanks ha
- Page 724 and 725:
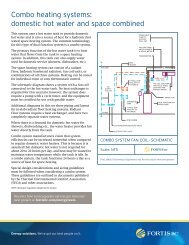
Burn blue. Save green. Alternative
- Page 726 and 727:
Terasen Approach
- Page 728 and 729:
Terasen Large Scale Alternative Ene
- Page 730 and 731:
Terasen Large Scale Alternative Ene
- Page 732 and 733:
Burn blue. Save green. Energy Effic
- Page 734 and 735:
Innovative Technologies Approved Fu
- Page 736 and 737:
Innovative Technologies Proposed Pr
- Page 738 and 739:
Innovative Technologies Natural gas
- Page 740 and 741:
Proposal for Innovative Technologie
- Page 742 and 743:
Proposed Innovative Technologies TG
- Page 744 and 745:
Proposed Innovative Technologies Po
- Page 746 and 747:
Burn blue. Save green. Structure &
- Page 748 and 749:
2009 EEC Report Structure • Intro
- Page 750 and 751:
2009 Program Results* - Highlights
- Page 752 and 753:
Research & Evaluation Activities
- Page 754 and 755:
Processes and Controls Overview •
- Page 756 and 757:
Presentation Agenda • Achievement
- Page 758 and 759:
Switch ‘N’ Shrink Oil and Propa
- Page 760 and 761:
Domestic Hot Water ENERGYSTAR ® Ta
- Page 762 and 763:
Whole Home Partnerships • Utility
- Page 764 and 765:
Burn blue. Save green. Commercial P
- Page 766 and 767:
2010 Programs Summary Hot Water Cus
- Page 768 and 769:
Custom Design Program Internal Appr
- Page 770 and 771:
Commercial Cooking Program Initial
- Page 772 and 773:
Timeline for 2010 Project Q 1 Q 2 Q
- Page 774 and 775:
Conservation for Affordable Housing
- Page 776 and 777:
2010 Programs Summary • REnEW •
- Page 778 and 779:
2010 Programs & Partnerships Energy
- Page 780 and 781:
2010 Timeline REnEW Energy Saving K
- Page 782 and 783:
Supply Chain Manufacturers Supplier
- Page 784 and 785:
Efficiency Partners 2009 Program Ac
- Page 786 and 787:
2010 Timeline Efficiency Partners P
- Page 788 and 789:
2009 Results Program Name Total (No
- Page 790 and 791:
2010 Timeline Project Q 1 Q 2 Q 3 Q
- Page 792 and 793:
Innovative Technologies g Backgroun
- Page 794 and 795:
Innovative Technologies g Terms of
- Page 796 and 797:
Innovative Technologies g Proposed
- Page 798 and 799:
California Standard Protocol Tests
- Page 800 and 801:
Example with Solar Thermal-City of
- Page 802 and 803:
Proposed p Innovative Technologies
- Page 804 and 805:
Innovative Technologies g -Summaryy
- Page 806 and 807:
Slide 15 d5 Arvind could you add so
- Page 808 and 809:
Innovative Technologies g -TGI Brea
- Page 810 and 811:
Proposed p Innovative Technologies
- Page 812 and 813:
Terasen Gas EEC Stakeholder Meeting
- Page 814 and 815:
Organization Goals Members Prioriti
- Page 816 and 817:
Organization Goals Members represen
- Page 818 and 819:
Organization Goals Members represen
- Page 820 and 821:
Terasen Gas EEC Stakeholder Meeting
- Page 822 and 823:
Sarah Smith, EEC Looking Ahead Ques
- Page 824 and 825:
Affordable Housing Discussion point
- Page 826 and 827:
Innovative Technologies and Industr
- Page 828 and 829:
Corporate Overview EEC Stakeholder
- Page 830 and 831:
Fortis in BC: Terasen Gas and Forti
- Page 832 and 833:
Natural Gas Vehicle Program for BC
- Page 834 and 835:
Overview • Market Context • NGV
- Page 836 and 837:
BC’s Motor Fuels Market Motor fue
- Page 838 and 839:
Historical Diesel Pricing vs. NG (D
- Page 840 and 841:
NGV Strategy • Focus on Heavy Dut
- Page 842 and 843:
GHG Implications • 17% of diesel
- Page 844 and 845:
NGVs Delivering Solutions Today Lig
- Page 846 and 847:
Terasen Gas Key Projects Applicatio
- Page 848 and 849:
Questions?
- Page 850 and 851:
2010 YTD Results • Portfolio TRC
- Page 852 and 853:
Funding approval request - 2012 and
- Page 854 and 855:
Terasen dealer (contractor) program
- Page 856 and 857:
FortisBC EEC Stakeholder Meeting Mi
- Page 858 and 859:
EEC Stakeholder Meeting March 15, 2
- Page 860 and 861:
2010 EEC Portfolio Highlights March
- Page 862 and 863:
Utility 2010 EEC Combined Conventio
- Page 864 and 865:
Utility 2011 EEC Combined Conventio
- Page 866 and 867:
2011 Commercial Programs Timeline (
- Page 868 and 869:
2011 Residential Customer Programs
- Page 870 and 871:
2011 Conservation for Affordable Ho
- Page 872 and 873:
2011 Innovative Technologies Timeli
- Page 874 and 875:
Utility (Year) FEI 2010 Actual FEI
- Page 876 and 877:
A Speed Bump re the NGV Program…
- Page 878 and 879:
EEC Accountability Mechanism (G-36-
- Page 880 and 881:
EEC Stakeholder Sessions (2010) •
- Page 882 and 883:
EEC Incentives for NGV: Summary 1 2
- Page 884 and 885:
2010 and 2011 Industrial Programs O
- Page 886 and 887:
Enabling Activity: Efficiency Partn
- Page 888 and 889:
2010 Conservation Education and Out
- Page 890 and 891:
FortisBC Conservation Potential Rev
- Page 892 and 893:
Background & Objectives • FortisB
- Page 894 and 895:
• GHG Reduction Targets • BC -
- Page 896 and 897:
Current Practice • Total Resource
- Page 898 and 899:
#1 - Avoided / Marginal Costs • T
- Page 900 and 901:
#1 - Avoided / Marginal Costs • I
- Page 902 and 903:
#1 - Discount Rate Impacts NPV Meas
- Page 904 and 905:
#1 - Discount Rate Impacts • Impa
- Page 906 and 907:
#1 - Free Riders / Spillover • Op
- Page 908 and 909:
#1 - Treatment of Non-energy • Th
- Page 910 and 911:
• The Issue #1 - Measure Life - S
- Page 912 and 913:
#1 - Program and Measure Life • I
- Page 914 and 915:
Option #2: Change B/C Test • Opti
- Page 916 and 917:
#2 - Use Societal Cost Test • Pro
- Page 918 and 919:
#2 - Use Societal Cost Test • Imp
- Page 920 and 921:
• Pros - More like new supply ana
- Page 922 and 923:
Summary - Screening Tests • Summa
- Page 924 and 925:
#3: GHG Based Approach • Options
- Page 926 and 927:
Carbon Reduction Supply Curve (Conc
- Page 928 and 929:
Thank you
- Page 930 and 931:
Strategy • 2012 - 2013 Revenue Re
- Page 932 and 933:
Additional Items • Split 75% FEI,
- Page 934 and 935:
Organization Goals of Organization
- Page 936 and 937:
Organization Goals of Organization
- Page 938 and 939:
Organization Goals of Organization
- Page 940 and 941:
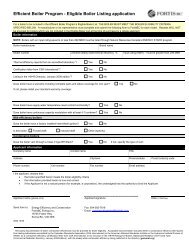
Appendix I EFFICIENT BOILER PROGRAM
- Page 942 and 943:
Table of contents Section Page The
- Page 944 and 945:
3.0 Program process All market part
- Page 946:
5.0 Incentives All market participa