

Travel in London Travel in London
travel-in-london-report-8
travel-in-london-report-8

Create successful ePaper yourself
Turn your PDF publications into a flip-book with our unique Google optimized e-Paper software.
5. Operational efficiency, public transport fares, asset condition and payment technologies<br />
stood at 8.0 per cent higher than <strong>in</strong> 2008, but showed no <strong>in</strong>crease over the<br />
most recent year.<br />
• The contactless payment card has become the preferred option for travel for a<br />
large and steadily <strong>in</strong>creas<strong>in</strong>g number of TfL customers. S<strong>in</strong>ce its launch <strong>in</strong><br />
September 2014 on the Tube, trams, DLR, <strong>London</strong> Overground and most<br />
National Rail services <strong>in</strong> <strong>London</strong>, TfL has become the fastest grow<strong>in</strong>g<br />
contactless merchant <strong>in</strong> Europe, with the number of contactless transactions<br />
grow<strong>in</strong>g by about 11 per cent per month.<br />
5.3 Transport operational efficiency and asset management<br />
Seek<strong>in</strong>g ways to reduce operat<strong>in</strong>g and other costs is important as it contributes to<br />
the aim of improv<strong>in</strong>g value-for-money, limits the demands made upon tax and fare<br />
payers, and helps to ensure that TfL has a budget that balances <strong>in</strong>come aga<strong>in</strong>st<br />
costs. In a similar way, management of the assets which TfL owns and which<br />
underlie services is crucial to ensure that TfL can meet its objectives of operat<strong>in</strong>g a<br />
safe, secure and reliable network, while also optimis<strong>in</strong>g <strong>in</strong>vestment decisions about<br />
asset ma<strong>in</strong>tenance and replacement.<br />
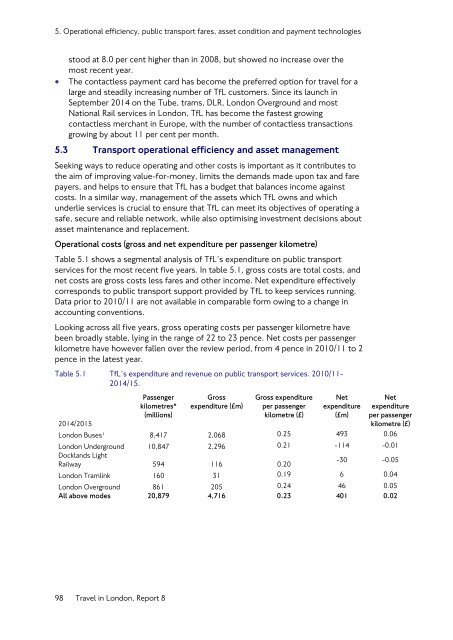
Operational costs (gross and net expenditure per passenger kilometre)<br />
Table 5.1 shows a segmental analysis of TfL’s expenditure on public transport<br />
services for the most recent five years. In table 5.1, gross costs are total costs, and<br />
net costs are gross costs less fares and other <strong>in</strong>come. Net expenditure effectively<br />
corresponds to public transport support provided by TfL to keep services runn<strong>in</strong>g.<br />
Data prior to 2010/11 are not available <strong>in</strong> comparable form ow<strong>in</strong>g to a change <strong>in</strong><br />
account<strong>in</strong>g conventions.<br />
Look<strong>in</strong>g across all five years, gross operat<strong>in</strong>g costs per passenger kilometre have<br />
been broadly stable, ly<strong>in</strong>g <strong>in</strong> the range of 22 to 23 pence. Net costs per passenger<br />
kilometre have however fallen over the review period, from 4 pence <strong>in</strong> 2010/11 to 2<br />
pence <strong>in</strong> the latest year.<br />
Table 5.1 TfL’s expenditure and revenue on public transport services. 2010/11-<br />
2014/15.<br />
Passenger<br />
kilometres*<br />
(millions)<br />
Gross<br />
expenditure (£m)<br />
Gross expenditure<br />
per passenger<br />
kilometre (£)<br />
Net<br />
expenditure<br />
(£m)<br />
2014/2015<br />
<strong>London</strong> Buses 1 8,417 2,068 0.25 493 0.06<br />
<strong>London</strong> Underground 10,847 2,296 0.21 -114 -0.01<br />
Net<br />
expenditure<br />
per passenger<br />
kilometre (£)<br />
Docklands Light<br />
-30 -0.05<br />
Railway 594 116 0.20<br />
<strong>London</strong> Traml<strong>in</strong>k 160 31 0.19 6 0.04<br />
<strong>London</strong> Overground 861 205 0.24 46 0.05<br />
All above modes 20,879 4,716 0.23 401 0.02<br />
98 <strong>Travel</strong> <strong>in</strong> <strong>London</strong>, Report 8


