

Travel in London Travel in London
travel-in-london-report-8
travel-in-london-report-8

You also want an ePaper? Increase the reach of your titles
YUMPU automatically turns print PDFs into web optimized ePapers that Google loves.
9. <strong>London</strong>’s air quality and greenhouse gas emissions and transport and public health<br />
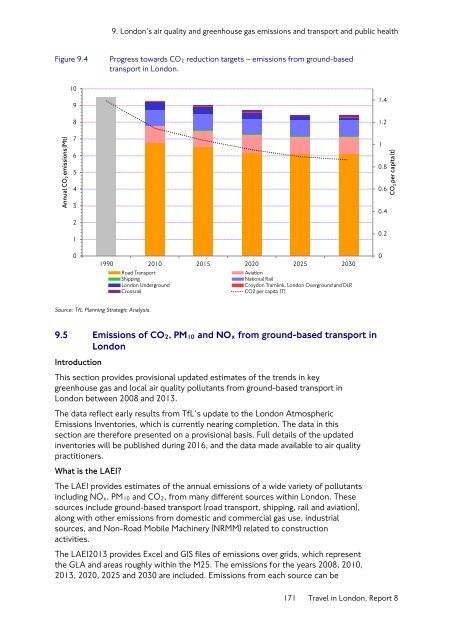
Figure 9.4<br />
Progress towards CO 2 reduction targets – emissions from ground-based<br />
transport <strong>in</strong> <strong>London</strong>.<br />
Annual CO 2 emissions (Mt)<br />
10<br />
9<br />
8<br />
7<br />
6<br />
5<br />
4<br />
3<br />
2<br />
1<br />
1.4<br />
1.2<br />
1<br />
0.8<br />
0.6<br />
0.4<br />
0.2<br />
CO 2 per capita (t)<br />
0<br />
1990 2010 2015 2020 2025 2030<br />
Road Transport<br />
Aviation<br />
Shipp<strong>in</strong>g<br />
National Rail<br />
<strong>London</strong> Underground<br />
Croydon Traml<strong>in</strong>k, <strong>London</strong> Overground and DLR<br />
Crossrail<br />
CO2 per capita (T)<br />
0<br />
Source: TfL Plann<strong>in</strong>g Strategic Analysis.<br />
9.5 Emissions of CO2, PM10 and NOx from ground-based transport <strong>in</strong><br />
<strong>London</strong><br />
Introduction<br />
This section provides provisional updated estimates of the trends <strong>in</strong> key<br />
greenhouse gas and local air quality pollutants from ground-based transport <strong>in</strong><br />
<strong>London</strong> between 2008 and 2013.<br />
The data reflect early results from TfL’s update to the <strong>London</strong> Atmospheric<br />
Emissions Inventories, which is currently near<strong>in</strong>g completion. The data <strong>in</strong> this<br />
section are therefore presented on a provisional basis. Full details of the updated<br />
<strong>in</strong>ventories will be published dur<strong>in</strong>g 2016, and the data made available to air quality<br />
practitioners.<br />
What is the LAEI?<br />
The LAEI provides estimates of the annual emissions of a wide variety of pollutants<br />
<strong>in</strong>clud<strong>in</strong>g NO x , PM 10 and CO 2 , from many different sources with<strong>in</strong> <strong>London</strong>. These<br />
sources <strong>in</strong>clude ground-based transport (road transport, shipp<strong>in</strong>g, rail and aviation),<br />
along with other emissions from domestic and commercial gas use, <strong>in</strong>dustrial<br />
sources, and Non-Road Mobile Mach<strong>in</strong>ery (NRMM) related to construction<br />
activities.<br />
The LAEI2013 provides Excel and GIS files of emissions over grids, which represent<br />
the GLA and areas roughly with<strong>in</strong> the M25. The emissions for the years 2008, 2010,<br />
2013, 2020, 2025 and 2030 are <strong>in</strong>cluded. Emissions from each source can be<br />
171 <strong>Travel</strong> <strong>in</strong> <strong>London</strong>, Report 8


