

Travel in London Travel in London
travel-in-london-report-8
travel-in-london-report-8

Create successful ePaper yourself
Turn your PDF publications into a flip-book with our unique Google optimized e-Paper software.
3. <strong>Travel</strong> trends by mode<br />
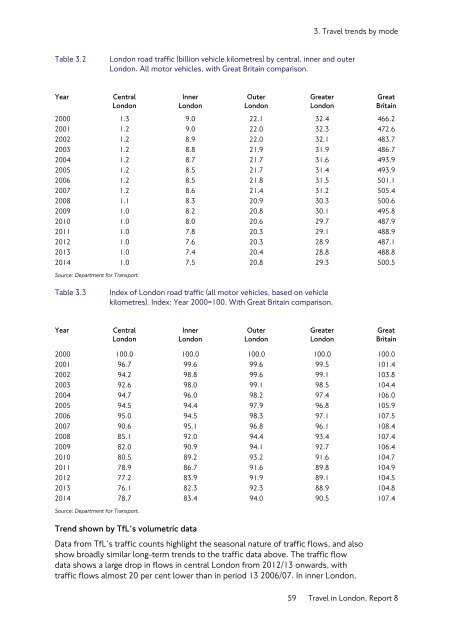
Table 3.2<br />
<strong>London</strong> road traffic (billion vehicle kilometres) by central, <strong>in</strong>ner and outer<br />
<strong>London</strong>. All motor vehicles, with Great Brita<strong>in</strong> comparison.<br />
Year<br />
Central<br />
<strong>London</strong><br />
Inner<br />
<strong>London</strong><br />
Outer<br />
<strong>London</strong><br />
Greater<br />
<strong>London</strong><br />
Great<br />
Brita<strong>in</strong><br />
2000 1.3 9.0 22.1 32.4 466.2<br />
2001 1.2 9.0 22.0 32.3 472.6<br />
2002 1.2 8.9 22.0 32.1 483.7<br />
2003 1.2 8.8 21.9 31.9 486.7<br />
2004 1.2 8.7 21.7 31.6 493.9<br />
2005 1.2 8.5 21.7 31.4 493.9<br />
2006 1.2 8.5 21.8 31.5 501.1<br />
2007 1.2 8.6 21.4 31.2 505.4<br />
2008 1.1 8.3 20.9 30.3 500.6<br />
2009 1.0 8.2 20.8 30.1 495.8<br />
2010 1.0 8.0 20.6 29.7 487.9<br />
2011 1.0 7.8 20.3 29.1 488.9<br />
2012 1.0 7.6 20.3 28.9 487.1<br />
2013 1.0 7.4 20.4 28.8 488.8<br />
2014 1.0 7.5 20.8 29.3 500.5<br />
Source: Department for Transport.<br />
Table 3.3<br />
Index of <strong>London</strong> road traffic (all motor vehicles, based on vehicle<br />
kilometres). Index: Year 2000=100. With Great Brita<strong>in</strong> comparison.<br />
Year<br />
Central<br />
<strong>London</strong><br />
Inner<br />
<strong>London</strong><br />
Outer<br />
<strong>London</strong><br />
Greater<br />
<strong>London</strong><br />
Great<br />
Brita<strong>in</strong><br />
2000 100.0 100.0 100.0 100.0 100.0<br />
2001 96.7 99.6 99.6 99.5 101.4<br />
2002 94.2 98.8 99.6 99.1 103.8<br />
2003 92.6 98.0 99.1 98.5 104.4<br />
2004 94.7 96.0 98.2 97.4 106.0<br />
2005 94.5 94.4 97.9 96.8 105.9<br />
2006 95.0 94.5 98.3 97.1 107.5<br />
2007 90.6 95.1 96.8 96.1 108.4<br />
2008 85.1 92.0 94.4 93.4 107.4<br />
2009 82.0 90.9 94.1 92.7 106.4<br />
2010 80.5 89.2 93.2 91.6 104.7<br />
2011 78.9 86.7 91.6 89.8 104.9<br />
2012 77.2 83.9 91.9 89.1 104.5<br />
2013 76.1 82.3 92.3 88.9 104.8<br />
2014 78.7 83.4 94.0 90.5 107.4<br />
Source: Department for Transport.<br />
Trend shown by TfL’s volumetric data<br />
Data from TfL’s traffic counts highlight the seasonal nature of traffic flows, and also<br />
show broadly similar long-term trends to the traffic data above. The traffic flow<br />
data shows a large drop <strong>in</strong> flows <strong>in</strong> central <strong>London</strong> from 2012/13 onwards, with<br />
traffic flows almost 20 per cent lower than <strong>in</strong> period 13 2006/07. In <strong>in</strong>ner <strong>London</strong>,<br />
59 <strong>Travel</strong> <strong>in</strong> <strong>London</strong>, Report 8


