

Travel in London Travel in London
travel-in-london-report-8
travel-in-london-report-8

Create successful ePaper yourself
Turn your PDF publications into a flip-book with our unique Google optimized e-Paper software.
3. <strong>Travel</strong> trends by mode<br />
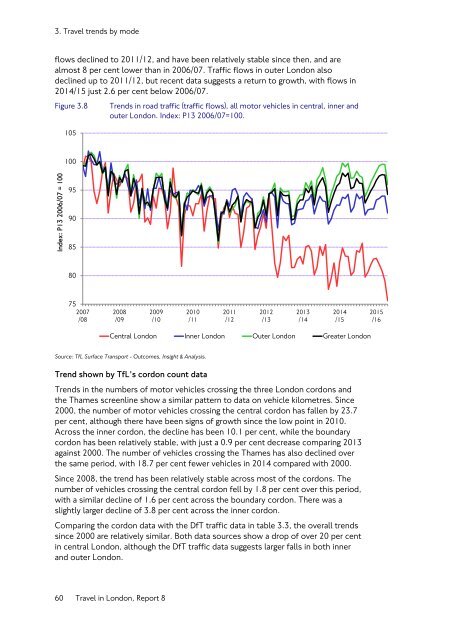
flows decl<strong>in</strong>ed to 2011/12, and have been relatively stable s<strong>in</strong>ce then, and are<br />
almost 8 per cent lower than <strong>in</strong> 2006/07. Traffic flows <strong>in</strong> outer <strong>London</strong> also<br />
decl<strong>in</strong>ed up to 2011/12, but recent data suggests a return to growth, with flows <strong>in</strong><br />
2014/15 just 2.6 per cent below 2006/07.<br />
Figure 3.8<br />
105<br />
Trends <strong>in</strong> road traffic (traffic flows), all motor vehicles <strong>in</strong> central, <strong>in</strong>ner and<br />
outer <strong>London</strong>. Index: P13 2006/07=100.<br />
100<br />
Index: P13 2006/07 = 100<br />
95<br />
90<br />
85<br />
80<br />
75<br />
2007<br />
/08<br />
2008<br />
/09<br />
2009<br />
/10<br />
2010<br />
/11<br />
2011<br />
/12<br />
2012<br />
/13<br />
2013<br />
/14<br />
2014<br />
/15<br />
2015<br />
/16<br />
Central <strong>London</strong> Inner <strong>London</strong> Outer <strong>London</strong> Greater <strong>London</strong><br />
Source: TfL Surface Transport - Outcomes, Insight & Analysis.<br />
Trend shown by TfL’s cordon count data<br />
Trends <strong>in</strong> the numbers of motor vehicles cross<strong>in</strong>g the three <strong>London</strong> cordons and<br />
the Thames screenl<strong>in</strong>e show a similar pattern to data on vehicle kilometres. S<strong>in</strong>ce<br />
2000, the number of motor vehicles cross<strong>in</strong>g the central cordon has fallen by 23.7<br />
per cent, although there have been signs of growth s<strong>in</strong>ce the low po<strong>in</strong>t <strong>in</strong> 2010.<br />
Across the <strong>in</strong>ner cordon, the decl<strong>in</strong>e has been 10.1 per cent, while the boundary<br />
cordon has been relatively stable, with just a 0.9 per cent decrease compar<strong>in</strong>g 2013<br />
aga<strong>in</strong>st 2000. The number of vehicles cross<strong>in</strong>g the Thames has also decl<strong>in</strong>ed over<br />
the same period, with 18.7 per cent fewer vehicles <strong>in</strong> 2014 compared with 2000.<br />
S<strong>in</strong>ce 2008, the trend has been relatively stable across most of the cordons. The<br />
number of vehicles cross<strong>in</strong>g the central cordon fell by 1.8 per cent over this period,<br />
with a similar decl<strong>in</strong>e of 1.6 per cent across the boundary cordon. There was a<br />
slightly larger decl<strong>in</strong>e of 3.8 per cent across the <strong>in</strong>ner cordon.<br />
Compar<strong>in</strong>g the cordon data with the DfT traffic data <strong>in</strong> table 3.3, the overall trends<br />
s<strong>in</strong>ce 2000 are relatively similar. Both data sources show a drop of over 20 per cent<br />
<strong>in</strong> central <strong>London</strong>, although the DfT traffic data suggests larger falls <strong>in</strong> both <strong>in</strong>ner<br />
and outer <strong>London</strong>.<br />
60 <strong>Travel</strong> <strong>in</strong> <strong>London</strong>, Report 8


