

Travel in London Travel in London
travel-in-london-report-8
travel-in-london-report-8

You also want an ePaper? Increase the reach of your titles
YUMPU automatically turns print PDFs into web optimized ePapers that Google loves.
10. The <strong>London</strong> 2012 Games and their legacy – an update<br />
Growth Boroughs and comparators <strong>in</strong> either person trip rates or car ownership,<br />
although the latest data are suggestive of a particular <strong>in</strong>crease <strong>in</strong> car ownership rates<br />
<strong>in</strong> Bark<strong>in</strong>g & Dagenham and a substantial fall <strong>in</strong> Tower Hamlets, which may<br />
particularly be associated with rapid population growth.<br />
Taken across the Growth Boroughs as a whole these trends – of a broadly stable<br />
trip rate and modest reduction <strong>in</strong> the rate of car ownership – would be consistent<br />
with both legacy and wider transport strategy goals. It should be borne <strong>in</strong> m<strong>in</strong>d, of<br />
course, when <strong>in</strong>terpret<strong>in</strong>g comparisons such as these, that the Growth Boroughs,<br />
whether <strong>in</strong> <strong>in</strong>ner or outer <strong>London</strong>, will predom<strong>in</strong>antly tend to share the<br />
characteristics of either <strong>in</strong>ner or outer <strong>London</strong>, and it is <strong>in</strong> this context that features<br />
such as the particularly low person trip rate for residents of Hackney should be<br />
seen.<br />
Trip rates by mode for residents of Growth Boroughs<br />
While foresee<strong>in</strong>g grow<strong>in</strong>g overall volumes of travel <strong>in</strong> the Growth Boroughs,<br />
reflect<strong>in</strong>g <strong>in</strong>creas<strong>in</strong>g population and economic activity, a key transport goal is that<br />
higher proportions of this travel are undertaken on public transport and, <strong>in</strong><br />
particular, by walk<strong>in</strong>g or cycl<strong>in</strong>g. The popularity of these latter two ‘active travel’<br />
modes is expected to benefit from the wider ‘sport<strong>in</strong>g legacy’ of the Games, as well<br />
as substantial <strong>in</strong>vestment <strong>in</strong> facilities designed to encourage their use.<br />
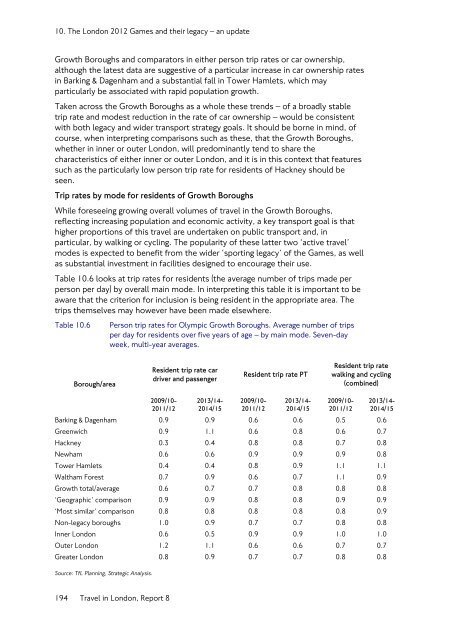
Table 10.6 looks at trip rates for residents (the average number of trips made per<br />
person per day) by overall ma<strong>in</strong> mode. In <strong>in</strong>terpret<strong>in</strong>g this table it is important to be<br />
aware that the criterion for <strong>in</strong>clusion is be<strong>in</strong>g resident <strong>in</strong> the appropriate area. The<br />
trips themselves may however have been made elsewhere.<br />
Table 10.6<br />
Person trip rates for Olympic Growth Boroughs. Average number of trips<br />
per day for residents over five years of age – by ma<strong>in</strong> mode. Seven-day<br />
week, multi-year averages.<br />
Borough/area<br />
Resident trip rate car<br />
driver and passenger<br />
Resident trip rate PT<br />
Resident trip rate<br />
walk<strong>in</strong>g and cycl<strong>in</strong>g<br />
(comb<strong>in</strong>ed)<br />
2009/10-<br />
2011/12<br />
2013/14-<br />
2014/15<br />
2009/10-<br />
2011/12<br />
2013/14-<br />
2014/15<br />
2009/10-<br />
2011/12<br />
2013/14-<br />
2014/15<br />
Bark<strong>in</strong>g & Dagenham 0.9 0.9 0.6 0.6 0.5 0.6<br />
Greenwich 0.9 1.1 0.6 0.8 0.6 0.7<br />
Hackney 0.3 0.4 0.8 0.8 0.7 0.8<br />
Newham 0.6 0.6 0.9 0.9 0.9 0.8<br />
Tower Hamlets 0.4 0.4 0.8 0.9 1.1 1.1<br />
Waltham Forest 0.7 0.9 0.6 0.7 1.1 0.9<br />
Growth total/average 0.6 0.7 0.7 0.8 0.8 0.8<br />
‘Geographic’ comparison 0.9 0.9 0.8 0.8 0.9 0.9<br />
‘Most similar’ comparison 0.8 0.8 0.8 0.8 0.8 0.9<br />
Non-legacy boroughs 1.0 0.9 0.7 0.7 0.8 0.8<br />
Inner <strong>London</strong> 0.6 0.5 0.9 0.9 1.0 1.0<br />
Outer <strong>London</strong> 1.2 1.1 0.6 0.6 0.7 0.7<br />
Greater <strong>London</strong> 0.8 0.9 0.7 0.7 0.8 0.8<br />
Source: TfL Plann<strong>in</strong>g, Strategic Analysis.<br />
194 <strong>Travel</strong> <strong>in</strong> <strong>London</strong>, Report 8


