

Travel in London Travel in London
travel-in-london-report-8
travel-in-london-report-8

You also want an ePaper? Increase the reach of your titles
YUMPU automatically turns print PDFs into web optimized ePapers that Google loves.
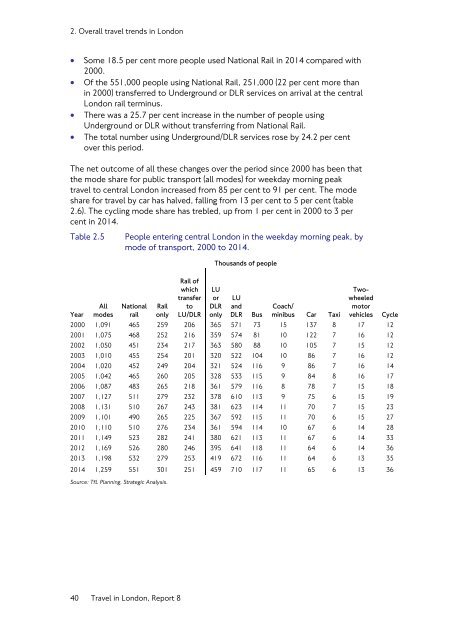
2. Overall travel trends <strong>in</strong> <strong>London</strong><br />
• Some 18.5 per cent more people used National Rail <strong>in</strong> 2014 compared with<br />
2000.<br />
• Of the 551,000 people us<strong>in</strong>g National Rail, 251,000 (22 per cent more than<br />
<strong>in</strong> 2000) transferred to Underground or DLR services on arrival at the central<br />
<strong>London</strong> rail term<strong>in</strong>us.<br />
• There was a 25.7 per cent <strong>in</strong>crease <strong>in</strong> the number of people us<strong>in</strong>g<br />
Underground or DLR without transferr<strong>in</strong>g from National Rail.<br />
• The total number us<strong>in</strong>g Underground/DLR services rose by 24.2 per cent<br />
over this period.<br />
The net outcome of all these changes over the period s<strong>in</strong>ce 2000 has been that<br />
the mode share for public transport (all modes) for weekday morn<strong>in</strong>g peak<br />
travel to central <strong>London</strong> <strong>in</strong>creased from 85 per cent to 91 per cent. The mode<br />
share for travel by car has halved, fall<strong>in</strong>g from 13 per cent to 5 per cent (table<br />
2.6). The cycl<strong>in</strong>g mode share has trebled, up from 1 per cent <strong>in</strong> 2000 to 3 per<br />
cent <strong>in</strong> 2014.<br />
Table 2.5<br />
Year<br />
All<br />
modes<br />
People enter<strong>in</strong>g central <strong>London</strong> <strong>in</strong> the weekday morn<strong>in</strong>g peak, by<br />
mode of transport, 2000 to 2014.<br />
National<br />
rail<br />
Rail<br />
only<br />
Rail of<br />
which<br />
transfer<br />
to<br />
LU/DLR<br />
Thousands of people<br />
LU<br />
or<br />
DLR<br />
only<br />
LU<br />
and<br />
DLR<br />
Bus<br />
Coach/<br />
m<strong>in</strong>ibus Car Taxi<br />
Twowheeled<br />
motor<br />
vehicles<br />
2000 1,091 465 259 206 365 571 73 15 137 8 17 12<br />
2001 1,075 468 252 216 359 574 81 10 122 7 16 12<br />
2002 1,050 451 234 217 363 580 88 10 105 7 15 12<br />
2003 1,010 455 254 201 320 522 104 10 86 7 16 12<br />
2004 1,020 452 249 204 321 524 116 9 86 7 16 14<br />
2005 1,042 465 260 205 328 533 115 9 84 8 16 17<br />
2006 1,087 483 265 218 361 579 116 8 78 7 15 18<br />
2007 1,127 511 279 232 378 610 113 9 75 6 15 19<br />
2008 1,131 510 267 243 381 623 114 11 70 7 15 23<br />
2009 1,101 490 265 225 367 592 115 11 70 6 15 27<br />
2010 1,110 510 276 234 361 594 114 10 67 6 14 28<br />
2011 1,149 523 282 241 380 621 113 11 67 6 14 33<br />
2012 1,169 526 280 246 395 641 118 11 64 6 14 36<br />
2013 1,198 532 279 253 419 672 116 11 64 6 13 35<br />
2014 1,259 551 301 251 459 710 117 11 65 6 13 36<br />
Source: TfL Plann<strong>in</strong>g, Strategic Analysis.<br />
Cycle<br />
40 <strong>Travel</strong> <strong>in</strong> <strong>London</strong>, Report 8


