

Travel in London Travel in London
travel-in-london-report-8
travel-in-london-report-8

You also want an ePaper? Increase the reach of your titles
YUMPU automatically turns print PDFs into web optimized ePapers that Google loves.
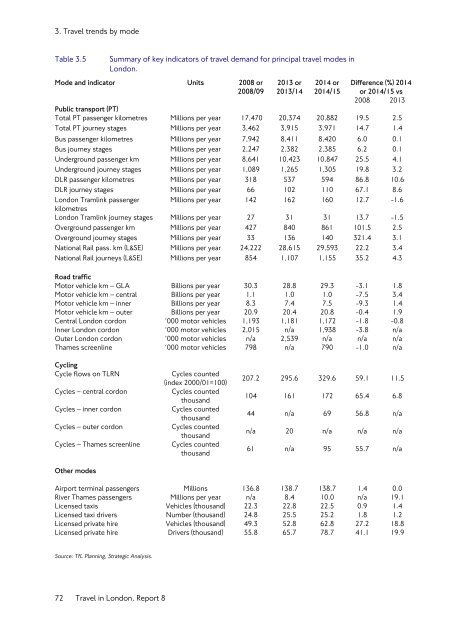
3. <strong>Travel</strong> trends by mode<br />
Table 3.5<br />
Summary of key <strong>in</strong>dicators of travel demand for pr<strong>in</strong>cipal travel modes <strong>in</strong><br />
<strong>London</strong>.<br />
Mode and <strong>in</strong>dicator Units 2008 or<br />
2008/09<br />
2013 or<br />
2013/14<br />
2014 or<br />
2014/15<br />
Difference (%) 2014<br />
or 2014/15 vs<br />
2008 2013<br />
Public transport (PT)<br />
Total PT passenger kilometres Millions per year 17,470 20,374 20,882 19.5 2.5<br />
Total PT journey stages Millions per year 3,462 3,915 3,971 14.7 1.4<br />
Bus passenger kilometres Millions per year 7,942 8,411 8,420 6.0 0.1<br />
Bus journey stages Millions per year 2,247 2,382 2,385 6.2 0.1<br />
Underground passenger km Millions per year 8,641 10,423 10,847 25.5 4.1<br />
Underground journey stages Millions per year 1,089 1,265 1,305 19.8 3.2<br />
DLR passenger kilometres Millions per year 318 537 594 86.8 10.6<br />
DLR journey stages Millions per year 66 102 110 67.1 8.6<br />
<strong>London</strong> Traml<strong>in</strong>k passenger Millions per year 142 162 160 12.7 -1.6<br />
kilometres<br />
<strong>London</strong> Traml<strong>in</strong>k journey stages Millions per year 27 31 31 13.7 -1.5<br />
Overground passenger km Millions per year 427 840 861 101.5 2.5<br />
Overground journey stages Millions per year 33 136 140 321.4 3.1<br />
National Rail pass. km (L&SE) Millions per year 24,222 28,615 29,593 22.2 3.4<br />
National Rail journeys (L&SE) Millions per year 854 1,107 1,155 35.2 4.3<br />
Road traffic<br />
Motor vehicle km – GLA Billions per year 30.3 28.8 29.3 -3.1 1.8<br />
Motor vehicle km – central Billions per year 1.1 1.0 1.0 -7.5 3.4<br />
Motor vehicle km – <strong>in</strong>ner Billions per year 8.3 7.4 7.5 -9.3 1.4<br />
Motor vehicle km – outer Billions per year 20.9 20.4 20.8 -0.4 1.9<br />
Central <strong>London</strong> cordon ‘000 motor vehicles 1,193 1,181 1,172 -1.8 -0.8<br />
Inner <strong>London</strong> cordon ‘000 motor vehicles 2,015 n/a 1,938 -3.8 n/a<br />
Outer <strong>London</strong> cordon ‘000 motor vehicles n/a 2,539 n/a n/a n/a<br />
Thames screenl<strong>in</strong>e ‘000 motor vehicles 798 n/a 790 -1.0 n/a<br />
Cycl<strong>in</strong>g<br />
Cycle flows on TLRN<br />
Cycles – central cordon<br />
Cycles – <strong>in</strong>ner cordon<br />
Cycles – outer cordon<br />
Cycles – Thames screenl<strong>in</strong>e<br />
Other modes<br />
Cycles counted<br />
(<strong>in</strong>dex 2000/01=100)<br />
Cycles counted<br />
thousand<br />
Cycles counted<br />
thousand<br />
Cycles counted<br />
thousand<br />
Cycles counted<br />
thousand<br />
207.2 295.6 329.6 59.1 11.5<br />
104 161 172 65.4 6.8<br />
44 n/a 69 56.8 n/a<br />
n/a 20 n/a n/a n/a<br />
61 n/a 95 55.7 n/a<br />
Airport term<strong>in</strong>al passengers Millions 136.8 138.7 138.7 1.4 0.0<br />
River Thames passengers Millions per year n/a 8.4 10.0 n/a 19.1<br />
Licensed taxis Vehicles (thousand) 22.3 22.8 22.5 0.9 1.4<br />
Licensed taxi drivers Number (thousand) 24.8 25.5 25.2 1.8 1.2<br />
Licensed private hire Vehicles (thousand) 49.3 52.8 62.8 27.2 18.8<br />
Licensed private hire Drivers (thousand) 55.8 65.7 78.7 41.1 19.9<br />
Source: TfL Plann<strong>in</strong>g, Strategic Analysis.<br />
72 <strong>Travel</strong> <strong>in</strong> <strong>London</strong>, Report 8


