

Travel in London Travel in London
travel-in-london-report-8
travel-in-london-report-8

Create successful ePaper yourself
Turn your PDF publications into a flip-book with our unique Google optimized e-Paper software.
2. Overall travel trends <strong>in</strong> <strong>London</strong><br />
for public transport use <strong>in</strong> <strong>London</strong>, with a correspond<strong>in</strong>g cont<strong>in</strong>ued net shift<br />
away from private motorised transport.<br />
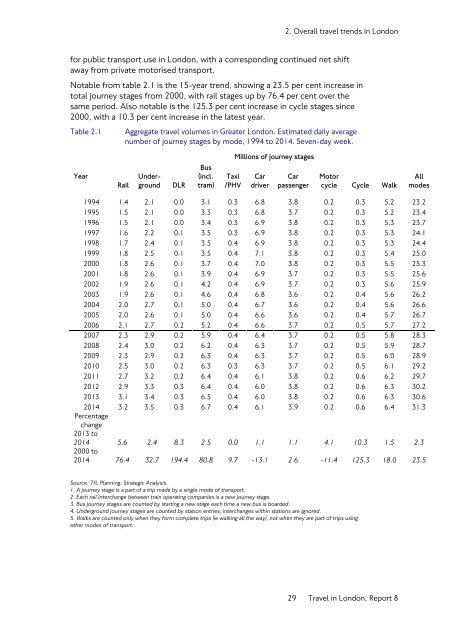
Notable from table 2.1 is the 15-year trend, show<strong>in</strong>g a 23.5 per cent <strong>in</strong>crease <strong>in</strong><br />
total journey stages from 2000, with rail stages up by 76.4 per cent over the<br />
same period. Also notable is the 125.3 per cent <strong>in</strong>crease <strong>in</strong> cycle stages s<strong>in</strong>ce<br />
2000, with a 10.3 per cent <strong>in</strong>crease <strong>in</strong> the latest year.<br />
Table 2.1<br />
Aggregate travel volumes <strong>in</strong> Greater <strong>London</strong>. Estimated daily average<br />
number of journey stages by mode, 1994 to 2014. Seven-day week.<br />
Year<br />
Rail<br />
Underground<br />
DLR<br />
Bus<br />
(<strong>in</strong>cl.<br />
tram)<br />
Taxi<br />
/PHV<br />
Millions of journey stages<br />
Car<br />
driver<br />
Car<br />
passenger<br />
Motor<br />
cycle Cycle Walk<br />
All<br />
modes<br />
1994 1.4 2.1 0.0 3.1 0.3 6.8 3.8 0.2 0.3 5.2 23.2<br />
1995 1.5 2.1 0.0 3.3 0.3 6.8 3.7 0.2 0.3 5.2 23.4<br />
1996 1.5 2.1 0.0 3.4 0.3 6.9 3.8 0.2 0.3 5.3 23.7<br />
1997 1.6 2.2 0.1 3.5 0.3 6.9 3.8 0.2 0.3 5.3 24.1<br />
1998 1.7 2.4 0.1 3.5 0.4 6.9 3.8 0.2 0.3 5.3 24.4<br />
1999 1.8 2.5 0.1 3.5 0.4 7.1 3.8 0.2 0.3 5.4 25.0<br />
2000 1.8 2.6 0.1 3.7 0.4 7.0 3.8 0.2 0.3 5.5 25.3<br />
2001 1.8 2.6 0.1 3.9 0.4 6.9 3.7 0.2 0.3 5.5 25.6<br />
2002 1.9 2.6 0.1 4.2 0.4 6.9 3.7 0.2 0.3 5.6 25.9<br />
2003 1.9 2.6 0.1 4.6 0.4 6.8 3.6 0.2 0.4 5.6 26.2<br />
2004 2.0 2.7 0.1 5.0 0.4 6.7 3.6 0.2 0.4 5.6 26.6<br />
2005 2.0 2.6 0.1 5.0 0.4 6.6 3.6 0.2 0.4 5.7 26.7<br />
2006 2.1 2.7 0.2 5.2 0.4 6.6 3.7 0.2 0.5 5.7 27.2<br />
2007 2.3 2.9 0.2 5.9 0.4 6.4 3.7 0.2 0.5 5.8 28.3<br />
2008 2.4 3.0 0.2 6.2 0.4 6.3 3.7 0.2 0.5 5.9 28.7<br />
2009 2.3 2.9 0.2 6.3 0.4 6.3 3.7 0.2 0.5 6.0 28.9<br />
2010 2.5 3.0 0.2 6.3 0.3 6.3 3.7 0.2 0.5 6.1 29.2<br />
2011 2.7 3.2 0.2 6.4 0.4 6.1 3.8 0.2 0.6 6.2 29.7<br />
2012 2.9 3.3 0.3 6.4 0.4 6.0 3.8 0.2 0.6 6.3 30.2<br />
2013 3.1 3.4 0.3 6.5 0.4 6.0 3.8 0.2 0.6 6.3 30.6<br />
2014 3.2 3.5 0.3 6.7 0.4 6.1 3.9 0.2 0.6 6.4 31.3<br />
Percentage<br />
change<br />
2013 to<br />
2014 5.6 2.4 8.3 2.5 0.0 1.1 1.1 4.1 10.3 1.5 2.3<br />
2000 to<br />
2014 76.4 32.7 194.4 80.8 9.7 -13.1 2.6 -11.4 125.3 18.0 23.5<br />
Source: TfL Plann<strong>in</strong>g, Strategic Analysis.<br />
1. A journey stage is a part of a trip made by a s<strong>in</strong>gle mode of transport.<br />
2. Each rail <strong>in</strong>terchange between tra<strong>in</strong> operat<strong>in</strong>g companies is a new journey stage.<br />
3. Bus journey stages are counted by start<strong>in</strong>g a new stage each time a new bus is boarded.<br />
4. Underground journey stages are counted by station entries; <strong>in</strong>terchanges with<strong>in</strong> stations are ignored.<br />
5. Walks are counted only when they form complete trips (ie walk<strong>in</strong>g all the way), not when they are part of trips us<strong>in</strong>g<br />
other modes of transport.<br />
29 <strong>Travel</strong> <strong>in</strong> <strong>London</strong>, Report 8


