

SÃntese Anual da Agricultura de Santa Catarina - 2001-2002 - Cepa
SÃntese Anual da Agricultura de Santa Catarina - 2001-2002 - Cepa
SÃntese Anual da Agricultura de Santa Catarina - 2001-2002 - Cepa

You also want an ePaper? Increase the reach of your titles
YUMPU automatically turns print PDFs into web optimized ePapers that Google loves.
leite<br />
Dentre os outros países com participação<br />
importante no mercado internacional, <strong>de</strong>stacam-se,<br />
principalmente, a continui<strong>da</strong><strong>de</strong> no crescimento<br />
<strong>da</strong>s produções <strong>da</strong> Nova Zelândia e <strong>da</strong><br />
Austrália e a redução na <strong>da</strong> Argentina. No período<br />
<strong>de</strong> 1997 a <strong>2002</strong>, a produção <strong>da</strong> Nova Zelândia<br />
cresceu quase 22% e a <strong>da</strong> Austrália, 19%.<br />
No caso <strong>da</strong> Argentina, a situação é inversa.<br />
A conjugação <strong>de</strong> fatores anteriores a <strong>2002</strong><br />
alia<strong>da</strong> a outros mais recentes – como: redução<br />
do consumo interno, sobrevalorização cambial,<br />
redução <strong>da</strong>s exportações, elevação dos<br />
preços dos insumos, baixo preços aos produtores,<br />
problemas <strong>de</strong> pagamento ao longo<br />
<strong>da</strong> ca<strong>de</strong>ia produtiva, dificul<strong>da</strong><strong>de</strong>s <strong>de</strong> parte do<br />
setor industrial, redução do po<strong>de</strong>r aquisitivo<br />
<strong>de</strong> gran<strong>de</strong> parte <strong>da</strong> população, retoma<strong>da</strong> do<br />
processo inflacionário, entre outros –, comprometem<br />
a produção leiteira argentina.<br />
Depois <strong>de</strong> um longo período <strong>de</strong> avanços, nos<br />
últimos anos a sua produção é <strong>de</strong>crescente.<br />
Segundo a Secretaría <strong>de</strong> <strong>Agricultura</strong>, Gana<strong>de</strong>ría,<br />
Pesca y Alimentación (SAGPyA), a produção<br />
argentina <strong>de</strong> leite <strong>de</strong> <strong>2002</strong> é projeta<strong>da</strong> em<br />
apenas 8,9 bilhões <strong>de</strong> litros, quase 6% abaixo<br />
dos 9,453 bilhões <strong>de</strong> <strong>2001</strong> e 14% abaixo do recor<strong>de</strong><br />
<strong>de</strong> 10,33 bilhões <strong>de</strong> litros <strong>de</strong> 1999.<br />
Embora os números do Us<strong>da</strong> sejam um<br />
pouco diferentes <strong>de</strong>stes <strong>da</strong> SAGPyA, o comportamento<br />
indicado é o mesmo.<br />
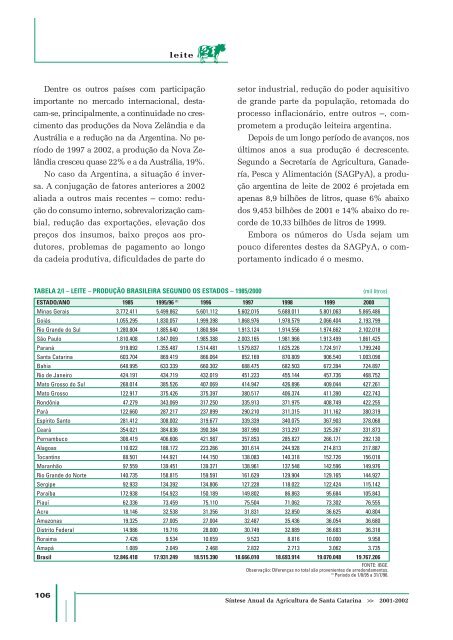
TABELA 2/I – LEITE – PRODUÇÃO BRASILEIRA SEGUNDO OS ESTADOS – 1985/2000<br />
(mil litros)<br />
ESTADO/ANO 1985 1995/96 (1) 1996 1997 1998 1999 2000<br />
Minas Gerais 3.772.411 5.499.862 5.601.112 5.602.015 5.688.011 5.801.063 5.865.486<br />
Goiás 1.055.295 1.830.057 1.999.398 1.868.976 1.978.579 2.066.404 2.193.799<br />
Rio Gran<strong>de</strong> do Sul 1.280.804 1.885.640 1.860.984 1.913.124 1.914.556 1.974.662 2.102.018<br />
São Paulo 1.810.408 1.847.069 1.985.388 2.003.165 1.981.966 1.913.499 1.861.425<br />
Paraná 919.892 1.355.487 1.514.481 1.579.837 1.625.226 1.724.917 1.799.240<br />
<strong>Santa</strong> <strong>Catarina</strong> 603.704 869.419 866.064 852.169 870.809 906.540 1.003.098<br />
Bahia 648.995 633.339 660.302 688.475 682.503 672.394 724.897<br />
Rio <strong>de</strong> Janeiro 424.191 434.719 432.019 451.223 455.144 457.736 468.752<br />
Mato Grosso do Sul 268.014 385.526 407.069 414.947 426.896 409.044 427.261<br />
Mato Grosso 122.917 375.426 375.397 380.517 406.374 411.390 422.743<br />
Rondônia 47.279 343.069 317.250 335.913 371.975 408.749 422.255<br />
Pará 122.660 287.217 237.899 290.210 311.315 311.162 380.319<br />
Espírito Santo 281.412 308.002 319.677 339.339 340.075 367.903 378.068<br />
Ceará 354.021 384.836 390.384 387.990 313.297 325.267 331.873<br />
Pernambuco 308.419 406.606 421.987 357.853 285.827 266.171 292.130<br />
Alagoas 110.022 188.172 223.266 301.614 244.928 214.813 217.887<br />
Tocantins 88.501 144.921 144.150 138.083 140.318 152.726 156.018<br />
Maranhão 97.559 139.451 139.371 138.961 137.548 142.596 149.976<br />
Rio Gran<strong>de</strong> do Norte 140.735 158.815 159.591 161.629 129.904 129.165 144.927<br />
Sergipe 92.933 134.392 134.806 127.228 118.022 122.424 115.142<br />
Paraíba 172.938 154.923 150.189 149.802 86.863 95.684 105.843<br />
Piauí 62.336 73.459 75.110 75.504 71.062 73.302 76.555<br />
Acre 18.146 32.538 31.356 31.831 32.850 36.625 40.804<br />
Amazonas 19.325 27.005 27.004 32.487 35.436 36.054 36.680<br />
Distrito Fe<strong>de</strong>ral 14.986 19.716 28.000 30.749 32.889 36.683 36.318<br />
Roraima 7.426 9.534 10.659 9.523 8.816 10.000 9.958<br />
Amapá 1.089 2.049 2.468 2.832 2.713 3.062 3.735<br />
Brasil 12.846.418 17.931.249 18.515.390 18.666.010 18.693.914 19.070.048 19.767.206<br />
FONTE: IBGE.<br />
Observação: Diferenças no total são provenientes <strong>de</strong> arredon<strong>da</strong>mentos.<br />
(1)<br />
Período <strong>de</strong> 1/8/95 a 31/7/96.<br />
106<br />
Síntese <strong>Anual</strong> <strong>da</strong> <strong>Agricultura</strong> <strong>de</strong> <strong>Santa</strong> <strong>Catarina</strong> >> <strong>2001</strong>-<strong>2002</strong>


