

SÃntese Anual da Agricultura de Santa Catarina - 2001-2002 - Cepa
SÃntese Anual da Agricultura de Santa Catarina - 2001-2002 - Cepa
SÃntese Anual da Agricultura de Santa Catarina - 2001-2002 - Cepa

You also want an ePaper? Increase the reach of your titles
YUMPU automatically turns print PDFs into web optimized ePapers that Google loves.
FUMO<br />
OBrasil ocupa papel <strong>de</strong> <strong>de</strong>staque<br />
na produção e no<br />
mercado internacional <strong>de</strong> fumo.<br />
É o terceiro produtor e primeiro<br />
exportador mundial <strong>de</strong>sse produto<br />
em folha.<br />
A fumicultura brasileira <strong>de</strong>pen<strong>de</strong><br />
muito do comportamento <strong>da</strong>s<br />
exportações, já que entre 60% e<br />
70% <strong>da</strong> produção tem como <strong>de</strong>stino<br />
o mercado externo. Assim, a<br />
produção nacional tem variado<br />
para mais ou para menos <strong>de</strong>pen<strong>de</strong>ndo,<br />
sobretudo, <strong>da</strong>s condições<br />
do mercado internacional.<br />
Nos últimos anos, como o Brasil<br />
ampliou o seu espaço no mercado<br />
internacional, a produção<br />
brasileira tem sido crescente. Essa<br />
maior participação brasileira é<br />
<strong>de</strong>corrente, principalmente, dos seguintes<br />
fatores: sensíveis reduções<br />
na produção e nos estoques<br />
mundiais; per<strong>da</strong> <strong>de</strong> competitivi<strong>da</strong><strong>de</strong><br />
<strong>da</strong>s exportações dos Estados<br />
Unidos e do Zimbábue; agressivi<strong>da</strong><strong>de</strong><br />
<strong>da</strong>s indústrias brasileiras no<br />
mercado internacional; competitivi<strong>da</strong><strong>de</strong><br />
do preço e <strong>da</strong> quali<strong>da</strong><strong>de</strong><br />
do fumo nacional em relação aos<br />
<strong>de</strong> outros importantes exportadores<br />
mundiais.<br />
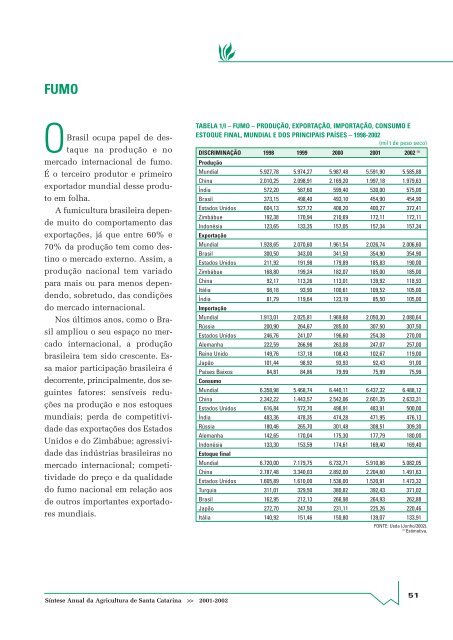
TABELA 1/I – FUMO – PRODUÇÃO, EXPORTAÇÃO, IMPORTAÇÃO, CONSUMO E<br />
ESTOQUE FINAL, MUNDIAL E DOS PRINCIPAIS PAÍSES – 1998-<strong>2002</strong><br />
(mil t <strong>de</strong> peso seco)<br />
DISCRIMINAÇÃO 1998 1999 2000 <strong>2001</strong> <strong>2002</strong> (1)<br />
Produção<br />
Mundial 5.927,78 5.974,27 5.987,48 5.591,90 5.585,88<br />
China 2.010,25 2.098,91 2.169,20 1.997,18 1.979,63<br />
Índia 572,20 587,60 599,40 530,00 575,00<br />
Brasil 373,15 498,40 493,10 454,90 454,90<br />
Estados Unidos 604,13 527,72 408,20 400,27 372,41<br />
Zimbábue 192,38 170,94 210,69 172,11 172,11<br />
Indonésia 123,65 133,35 157,05 157,34 157,34<br />
Exportação<br />
Mundial 1.928,65 2.070,60 1.961,54 2.026,74 2.006,60<br />
Brasil 300,50 343,00 341,50 354,90 354,90<br />
Estados Unidos 211,92 191,98 179,89 185,83 190,00<br />
Zimbábue 168,80 199,24 182,07 185,00 185,00<br />
China 92,17 113,26 113,01 139,92 118,93<br />
Itália 98,18 93,90 100,61 109,52 105,00<br />
Índia 81,79 119,64 123,19 85,50 105,00<br />
Importação<br />
Mundial 1.913,01 2.025,81 1.969,68 2.050,30 2.080,64<br />
Rússia 200,90 264,67 285,00 307,50 307,50<br />
Estados Unidos 246,76 241,07 196,60 254,38 270,00<br />
Alemanha 222,59 266,98 263,08 247,07 257,00<br />
Reino Unido 149,76 137,18 108,43 102,67 119,00<br />
Japão 101,44 98,92 93,93 92,43 91,00<br />
Países Baixos 84,81 84,86 79,99 75,99 75,99<br />
Consumo<br />
Mundial 6.358,98 5.468,74 6.440,11 6.437,32 6.488,12<br />
China 2.342,22 1.443,57 2.542,06 2.601,35 2.633,31<br />
Estados Unidos 616,84 572,70 498,91 483,91 500,00<br />
Índia 483,36 478,35 474,28 471,95 476,13<br />
Rússia 180,46 265,70 301,48 308,51 309,30<br />
Alemanha 142,65 170,04 175,30 177,79 180,00<br />
Indonésia 133,30 153,59 174,61 169,40 169,40<br />
Estoque final<br />
Mundial 6.720,00 7.179,75 6.732,71 5.910,86 5.082,05<br />
China 2.787,48 3.340,03 2.892,00 2.204,60 1.491,63<br />
Estados Unidos 1.605,89 1.610,00 1.536,00 1.520,91 1.473,32<br />
Turquia 311,01 329,50 380,82 392,43 371,02<br />
Brasil 162,95 212,13 266,98 264,93 262,88<br />
Japão 272,70 247,50 231,11 225,26 220,46<br />
Itália 140,92 151,46 150,80 139,07 133,91<br />
FONTE: Us<strong>da</strong> (Junho/<strong>2002</strong>).<br />
(1)<br />
Estimativa.<br />
Síntese <strong>Anual</strong> <strong>da</strong> <strong>Agricultura</strong> <strong>de</strong> <strong>Santa</strong> <strong>Catarina</strong> >> <strong>2001</strong>-<strong>2002</strong><br />
51


