

SÃntese Anual da Agricultura de Santa Catarina - 2001-2002 - Cepa
SÃntese Anual da Agricultura de Santa Catarina - 2001-2002 - Cepa
SÃntese Anual da Agricultura de Santa Catarina - 2001-2002 - Cepa

You also want an ePaper? Increase the reach of your titles
YUMPU automatically turns print PDFs into web optimized ePapers that Google loves.
pesca<br />
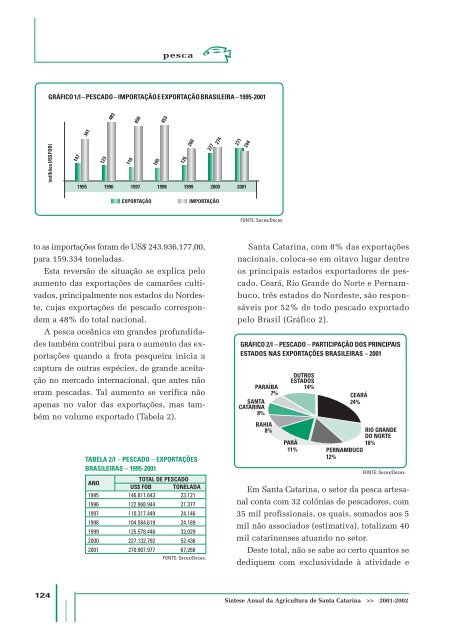
GRÁFICO 1/I – PESCADO – IMPORTAÇÃO E EXPORTAÇÃO BRASILEIRA – 1995-<strong>2001</strong><br />
483<br />
450<br />
453<br />
341<br />
260<br />
274<br />
244<br />
271<br />
(milhões US$ FOB)<br />
147<br />
1995<br />
123<br />
110<br />
105<br />
126<br />
1996 1997 1998 1999 2000 <strong>2001</strong><br />
227<br />
EXPORTAÇÃO<br />
IMPORTAÇÃO<br />
FONTE: Secex/Decex.<br />
to as importações foram <strong>de</strong> US$ 243.936.177,00,<br />
para 159.334 tonela<strong>da</strong>s.<br />
Esta reversão <strong>de</strong> situação se explica pelo<br />
aumento <strong>da</strong>s exportações <strong>de</strong> camarões cultivados,<br />
principalmente nos estados do Nor<strong>de</strong>ste,<br />
cujas exportações <strong>de</strong> pescado correspon<strong>de</strong>m<br />
a 48% do total nacional.<br />
A pesca oceânica em gran<strong>de</strong>s profundi<strong>da</strong><strong>de</strong>s<br />
também contribui para o aumento <strong>da</strong>s exportações<br />
quando a frota pesqueira inicia a<br />
captura <strong>de</strong> outras espécies, <strong>de</strong> gran<strong>de</strong> aceitação<br />
no mercado internacional, que antes não<br />
eram pesca<strong>da</strong>s. Tal aumento se verifica não<br />
apenas no valor <strong>da</strong>s exportações, mas também<br />
no volume exportado (Tabela 2).<br />
TABELA 2/I – PESCADO – EXPORTAÇÕES<br />
BRASILEIRAS – 1995-<strong>2001</strong><br />
TOTAL DE PESCADO<br />
ANO<br />
US$ FOB TONELADA<br />
1995 146.811.643 23.121<br />
1996 122.968.944 21.377<br />
1997 110.317.449 24.146<br />
1998 104.584.619 24.189<br />
1999 125.578.446 32.029<br />
2000 227.132.792 52.436<br />
<strong>2001</strong> 270.907.977 67.268<br />
FONTE: Secex/Decex.<br />
<strong>Santa</strong> <strong>Catarina</strong>, com 8% <strong>da</strong>s exportações<br />
nacionais, coloca-se em oitavo lugar <strong>de</strong>ntre<br />
os principais estados exportadores <strong>de</strong> pescado.<br />
Ceará, Rio Gran<strong>de</strong> do Norte e Pernambuco,<br />
três estados do Nor<strong>de</strong>ste, são responsáveis<br />
por 52% <strong>de</strong> todo pescado exportado<br />
pelo Brasil (Gráfico 2).<br />
GRÁFICO 2/I – PESCADO – PARTICIPAÇÃO DOS PRINCIPAIS<br />
ESTADOS NAS EXPORTAÇÕES BRASILEIRAS – <strong>2001</strong><br />
PARAÍBA<br />
7%<br />
SANTA<br />
CATARINA<br />
8%<br />
BAHIA<br />
8%<br />
OUTROS<br />
ESTADOS<br />
14%<br />
PARÁ<br />
11%<br />
CEARÁ<br />
24%<br />
PERNAMBUCO<br />
12%<br />
RIO GRANDE<br />
DO NORTE<br />
16%<br />
FONTE: Secex/Decex.<br />
Em <strong>Santa</strong> <strong>Catarina</strong>, o setor <strong>da</strong> pesca artesanal<br />
conta com 32 colônias <strong>de</strong> pescadores, com<br />
35 mil profissionais, os quais, somados aos 5<br />
mil não associados (estimativa), totalizam 40<br />
mil catarinenses atuando no setor.<br />
Deste total, não se sabe ao certo quantos se<br />
<strong>de</strong>diquem com exclusivi<strong>da</strong><strong>de</strong> à ativi<strong>da</strong><strong>de</strong> e<br />
124<br />
Síntese <strong>Anual</strong> <strong>da</strong> <strong>Agricultura</strong> <strong>de</strong> <strong>Santa</strong> <strong>Catarina</strong> >> <strong>2001</strong>-<strong>2002</strong>


