

SÃntese Anual da Agricultura de Santa Catarina - 2001-2002 - Cepa
SÃntese Anual da Agricultura de Santa Catarina - 2001-2002 - Cepa
SÃntese Anual da Agricultura de Santa Catarina - 2001-2002 - Cepa

You also want an ePaper? Increase the reach of your titles
YUMPU automatically turns print PDFs into web optimized ePapers that Google loves.
anana<br />
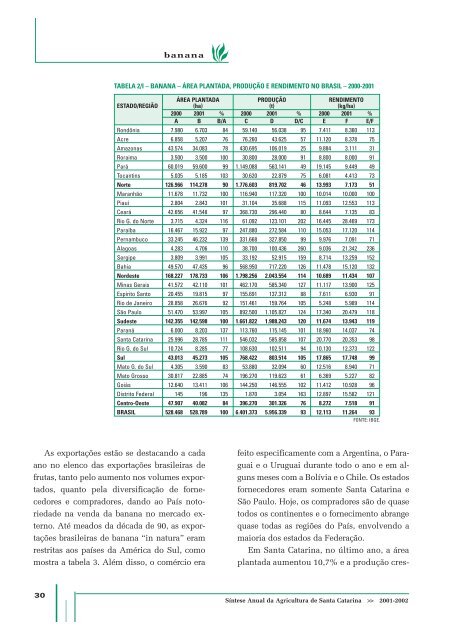
TABELA 2/I – BANANA – ÁREA PLANTADA, PRODUÇÃO E RENDIMENTO NO BRASIL – 2000-<strong>2001</strong><br />
ÁREA PLANTADA PRODUÇÃO RENDIMENTO<br />
ESTADO/REGIÃO (ha) (t) (kg/ha)<br />
2000 <strong>2001</strong> % 2000 <strong>2001</strong> % 2000 <strong>2001</strong> %<br />
A B B/A C D D/C E F E/F<br />
Rondônia 7.980 6.703 84 59.140 56.038 95 7.411 8.360 113<br />
Acre 6.858 5.207 76 76.260 43.625 57 11.120 8.378 75<br />
Amazonas 43.574 34.083 78 430.695 106.019 25 9.884 3.111 31<br />
Roraima 3.500 3.500 100 30.800 28.000 91 8.800 8.000 91<br />
Pará 60.019 59.600 99 1.149.088 563.141 49 19.145 9.449 49<br />
Tocantins 5.035 5.185 103 30.620 22.879 75 6.081 4.413 73<br />
Norte 126.966 114.278 90 1.776.603 819.702 46 13.993 7.173 51<br />
Maranhão 11.678 11.732 100 116.940 117.320 100 10.014 10.000 100<br />
Piauí 2.804 2.843 101 31.104 35.688 115 11.093 12.553 113<br />
Ceará 42.656 41.548 97 368.730 296.440 80 8.644 7.135 83<br />
Rio G. do Norte 3.715 4.324 116 61.092 123.101 202 16.445 28.469 173<br />
Paraíba 16.467 15.922 97 247.880 272.584 110 15.053 17.120 114<br />
Pernambuco 33.245 46.232 139 331.668 327.850 99 9.976 7.091 71<br />
Alagoas 4.283 4.706 110 38.700 100.436 260 9.036 21.342 236<br />
Sergipe 3.809 3.991 105 33.192 52.915 159 8.714 13.259 152<br />
Bahia 49.570 47.435 96 568.950 717.220 126 11.478 15.120 132<br />
Nor<strong>de</strong>ste 168.227 178.733 106 1.798.256 2.043.554 114 10.689 11.434 107<br />
Minas Gerais 41.572 42.110 101 462.170 585.340 127 11.117 13.900 125<br />
Espírito Santo 20.455 19.815 97 155.691 137.312 88 7.611 6.930 91<br />
Rio <strong>de</strong> Janeiro 28.858 26.676 92 151.461 159.764 105 5.248 5.989 114<br />
São Paulo 51.470 53.997 105 892.500 1.105.827 124 17.340 20.479 118<br />
Su<strong>de</strong>ste 142.355 142.598 100 1.661.822 1.988.243 120 11.674 13.943 119<br />
Paraná 6.000 8.203 137 113.760 115.145 101 18.960 14.037 74<br />
<strong>Santa</strong> <strong>Catarina</strong> 25.996 28.785 111 546.032 585.858 107 20.770 20.353 98<br />
Rio G. do Sul 10.724 8.285 77 108.630 102.511 94 10.130 12.373 122<br />
Sul 43.013 45.273 105 768.422 803.514 105 17.865 17.748 99<br />
Mato G. do Sul 4.305 3.590 83 53.880 32.094 60 12.516 8.940 71<br />
Mato Grosso 30.817 22.885 74 196.270 119.623 61 6.369 5.227 82<br />
Goiás 12.640 13.411 106 144.250 146.555 102 11.412 10.928 96<br />
Distrito Fe<strong>de</strong>ral 145 196 135 1.870 3.054 163 12.897 15.582 121<br />
Centro-Oeste 47.907 40.082 84 396.270 301.326 76 8.272 7.518 91<br />
BRASIL 528.468 528.789 100 6.401.373 5.956.339 93 12.113 11.264 93<br />
FONTE: IBGE.<br />
As exportações estão se <strong>de</strong>stacando a ca<strong>da</strong><br />
ano no elenco <strong>da</strong>s exportações brasileiras <strong>de</strong><br />
frutas, tanto pelo aumento nos volumes exportados,<br />
quanto pela diversificação <strong>de</strong> fornecedores<br />
e compradores, <strong>da</strong>ndo ao País notorie<strong>da</strong><strong>de</strong><br />
na ven<strong>da</strong> <strong>da</strong> banana no mercado externo.<br />
Até meados <strong>da</strong> déca<strong>da</strong> <strong>de</strong> 90, as exportações<br />
brasileiras <strong>de</strong> banana “in natura” eram<br />
restritas aos países <strong>da</strong> América do Sul, como<br />
mostra a tabela 3. Além disso, o comércio era<br />
feito especificamente com a Argentina, o Paraguai<br />
e o Uruguai durante todo o ano e em alguns<br />
meses com a Bolívia e o Chile. Os estados<br />
fornecedores eram somente <strong>Santa</strong> <strong>Catarina</strong> e<br />
São Paulo. Hoje, os compradores são <strong>de</strong> quase<br />
todos os continentes e o fornecimento abrange<br />
quase to<strong>da</strong>s as regiões do País, envolvendo a<br />
maioria dos estados <strong>da</strong> Fe<strong>de</strong>ração.<br />
Em <strong>Santa</strong> <strong>Catarina</strong>, no último ano, a área<br />
planta<strong>da</strong> aumentou 10,7% e a produção cres-<br />
30<br />
Síntese <strong>Anual</strong> <strong>da</strong> <strong>Agricultura</strong> <strong>de</strong> <strong>Santa</strong> <strong>Catarina</strong> >> <strong>2001</strong>-<strong>2002</strong>


