

SÃntese Anual da Agricultura de Santa Catarina - 2001-2002 - Cepa
SÃntese Anual da Agricultura de Santa Catarina - 2001-2002 - Cepa
SÃntese Anual da Agricultura de Santa Catarina - 2001-2002 - Cepa

Create successful ePaper yourself
Turn your PDF publications into a flip-book with our unique Google optimized e-Paper software.
parte 2<br />
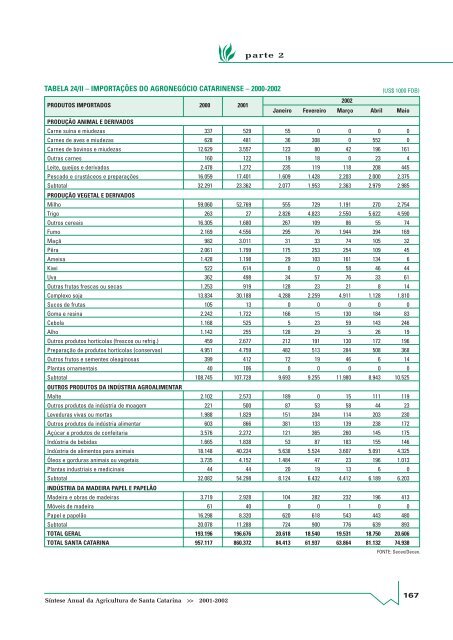
TABELA 24/II – IMPORTAÇÕES DO AGRONEGÓCIO CATARINENSE – 2000-<strong>2002</strong><br />
(US$ 1000 FOB)<br />
PRODUTOS IMPORTADOS 2000 <strong>2001</strong><br />
<strong>2002</strong><br />
Janeiro Fevereiro Março Abril Maio<br />
PRODUÇÃO ANIMAL E DERIVADOS<br />
Carne suína e miu<strong>de</strong>zas 337 529 55 0 0 0 0<br />
Carnes <strong>de</strong> aves e miu<strong>de</strong>zas 628 481 36 308 0 552 0<br />
Carnes <strong>de</strong> bovinos e miu<strong>de</strong>zas 12.629 3.557 123 80 42 196 161<br />
Outras carnes 160 122 19 18 0 23 4<br />
Leite, queijos e <strong>de</strong>rivados 2.478 1.272 235 119 118 208 445<br />
Pescado e crustáceos e preparações 16.059 17.401 1.609 1.428 2.203 2.000 2.375<br />
Subtotal 32.291 23.362 2.077 1.953 2.363 2.979 2.985<br />
PRODUÇÃO VEGETAL E DERIVADOS<br />
Milho 59.060 52.769 555 729 1.191 270 2.754<br />
Trigo 263 27 2.826 4.823 2.550 5.622 4.590<br />
Outros cereais 16.305 1.680 267 109 86 55 74<br />
Fumo 2.169 4.556 295 76 1.944 394 169<br />
Maçã 982 3.011 31 33 74 105 32<br />
Pêra 2.061 1.799 175 253 254 109 45<br />
Ameixa 1.428 1.198 29 103 161 134 6<br />
Kiwi 522 614 0 0 58 46 44<br />
Uva 362 498 34 57 76 33 61<br />
Outras frutas frescas ou secas 1.253 919 128 23 21 8 14<br />
Complexo soja 13.834 30.188 4.288 2.259 4.911 1.128 1.810<br />
Sucos <strong>de</strong> frutas 105 13 0 0 0 0 0<br />
Goma e resina 2.242 1.722 166 15 130 184 83<br />
Cebola 1.168 525 5 23 59 143 246<br />
Alho 1.142 255 128 29 5 26 19<br />
Outros produtos hortícolas (frescos ou refrig.) 459 2.677 212 191 130 172 196<br />
Preparação <strong>de</strong> produtos hortícolas (conservas) 4.951 4.759 482 513 284 508 368<br />
Outros frutos e sementes oleaginosas 399 412 72 19 46 6 14<br />
Plantas ornamentais 40 106 0 0 0 0 0<br />
Subtotal 108.745 107.728 9.693 9.255 11.980 8.943 10.525<br />
OUTROS PRODUTOS DA INDÚSTRIA AGROALIMENTAR<br />
Malte 2.102 2.573 189 0 15 111 119<br />
Outros produtos <strong>da</strong> indústria <strong>de</strong> moagem 221 500 87 53 58 44 23<br />
Leveduras vivas ou mortas 1.988 1.829 151 204 114 203 230<br />
Outros produtos <strong>da</strong> indústria alimentar 603 866 381 133 139 238 172<br />
Açúcar e produtos <strong>de</strong> confeitaria 3.576 2.272 121 365 260 145 175<br />
Indústria <strong>de</strong> bebi<strong>da</strong>s 1.665 1.838 53 87 183 155 146<br />
Indústria <strong>de</strong> alimentos para animais 18.148 40.224 5.638 5.524 3.607 5.091 4.325<br />
Óleos e gorduras animais ou vegetais 3.735 4.152 1.484 47 23 196 1.013<br />
Plantas industriais e medicinais 44 44 20 19 13 6 0<br />
Subtotal 32.082 54.298 8.124 6.432 4.412 6.189 6.203<br />
INDÚSTRIA DA MADEIRA PAPEL E PAPELÃO<br />
Ma<strong>de</strong>ira e obras <strong>de</strong> ma<strong>de</strong>iras 3.719 2.928 104 282 232 196 413<br />
Móveis <strong>de</strong> ma<strong>de</strong>ira 61 40 0 0 1 0 0<br />
Papel e papelão 16.298 8.320 620 618 543 443 480<br />
Subtotal 20.078 11.288 724 900 776 639 893<br />
TOTAL GERAL 193.196 196.676 20.618 18.540 19.531 18.750 20.606<br />
TOTAL SANTA CATARINA 957.117 860.372 84.413 61.937 63.864 81.132 74.938<br />
FONTE: Secex/Decex.<br />
Síntese <strong>Anual</strong> <strong>da</strong> <strong>Agricultura</strong> <strong>de</strong> <strong>Santa</strong> <strong>Catarina</strong> >> <strong>2001</strong>-<strong>2002</strong><br />
167


