

SÃntese Anual da Agricultura de Santa Catarina - 2001-2002 - Cepa
SÃntese Anual da Agricultura de Santa Catarina - 2001-2002 - Cepa
SÃntese Anual da Agricultura de Santa Catarina - 2001-2002 - Cepa

You also want an ePaper? Increase the reach of your titles
YUMPU automatically turns print PDFs into web optimized ePapers that Google loves.
cebola<br />
GRÁFICO 5/I – CEBOLA NACIONAL – PREÇOS MÉDIOS<br />
DE COMERCIALIZAÇÃO NA CEAGESP – 2000-<strong>2001</strong><br />
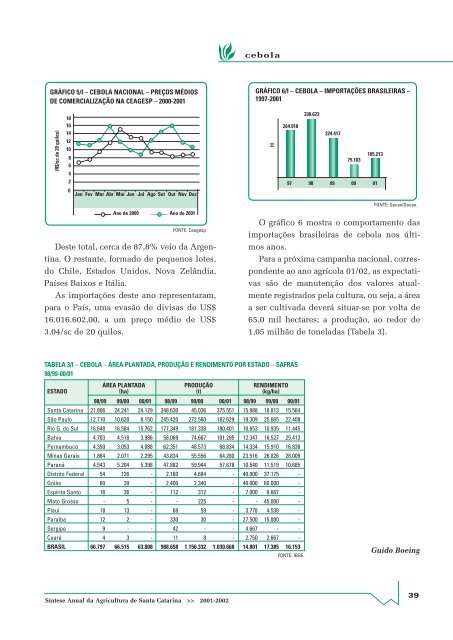
GRÁFICO 6/I – CEBOLA – IMPORTAÇÕES BRASILEIRAS –<br />
1997-<strong>2001</strong><br />
(R$/sc <strong>de</strong> 20 quilos)<br />
18<br />
16<br />
14<br />
12<br />
10<br />
8<br />
6<br />
4<br />
(t)<br />
264.918<br />
330.623<br />
224.417<br />
75.103<br />
105.213<br />
2<br />
0<br />
Jan Fev Mar Abr Mai Jun<br />
Jul Ago Set Out Nov Dez<br />
97 98 99 00 01<br />
Ano <strong>de</strong> 2000 Ano <strong>de</strong> <strong>2001</strong><br />
FONTE: Ceagesp.<br />
Deste total, cerca <strong>de</strong> 87,8% veio <strong>da</strong> Argentina.<br />
O restante, formado <strong>de</strong> pequenos lotes,<br />
do Chile, Estados Unidos, Nova Zelândia,<br />
Países Baixos e Itália.<br />
As importações <strong>de</strong>ste ano representaram,<br />
para o País, uma evasão <strong>de</strong> divisas <strong>de</strong> US$<br />
16.016.602,00, a um preço médio <strong>de</strong> US$<br />
3,04/sc <strong>de</strong> 20 quilos.<br />
FONTE: Secex/Decex.<br />
O gráfico 6 mostra o comportamento <strong>da</strong>s<br />
importações brasileiras <strong>de</strong> cebola nos últimos<br />
anos.<br />
Para a próxima campanha nacional, correspon<strong>de</strong>nte<br />
ao ano agrícola 01/02, as expectativas<br />
são <strong>de</strong> manutenção dos valores atualmente<br />
registrados pela cultura, ou seja, a área<br />
a ser cultiva<strong>da</strong> <strong>de</strong>verá situar-se por volta <strong>de</strong><br />
65,0 mil hectares; a produção, ao redor <strong>de</strong><br />
1,05 milhão <strong>de</strong> tonela<strong>da</strong>s (Tabela 3).<br />
TABELA 3/I – CEBOLA – ÁREA PLANTADA, PRODUÇÃO E RENDIMENTO POR ESTADO – SAFRAS<br />
98/99-00/01<br />
ÁREA PLANTADA PRODUÇÃO RENDIMENTO<br />
ESTADO (ha) (t) (kg/ha)<br />
98/99 99/00 00/01 98/99 99/00 00/01 98/99 99/00 00/01<br />
<strong>Santa</strong> <strong>Catarina</strong> 21.806 24.241 24.129 348.630 45.036 375.551 15.988 18.813 15.564<br />
São Paulo 12.710 10.620 8.150 245.420 272.560 182.629 19.309 25.665 22.408<br />
Rio G. do Sul 16.648 16.584 15.762 177.349 181.338 180.401 10.653 10.935 11.445<br />
Bahia 4.703 4.518 3.986 58.069 74.667 101.295 12.347 16.527 25.413<br />
Pernambuco 4.350 3.053 4.088 62.351 48.573 68.834 14.334 15.910 16.838<br />
Minas Gerais 1.864 2.071 2.295 43.834 55.556 64.280 23.516 26.826 28.009<br />
Paraná 4.543 5.204 5.398 47.882 59.944 57.678 10.540 11.519 10.685<br />
Distrito Fe<strong>de</strong>ral 54 126 - 2.160 4.684 - 40.000 37.175 -<br />
Goiás 60 39 - 2.400 2.340 - 40.000 60.000 -<br />
Espírito Santo 16 36 - 112 312 - 7.000 8.667 -<br />
Mato Grosso - 5 - - 225 - - 45.000 -<br />
Piauí 18 13 - 68 59 - 3.778 4.538 -<br />
Paraíba 12 2 - 330 30 - 27.500 15.000 -<br />
Sergipe 9 - - 42 - - 4.667 - -<br />
Ceará 4 3 - 11 8 - 2.750 2.667 -<br />
BRASIL 66.797 66.515 63.808 988.658 1.156.332 1.030.668 14.801 17.385 16.153<br />
FONTE: IBGE.<br />
Guido Boeing<br />
Síntese <strong>Anual</strong> <strong>da</strong> <strong>Agricultura</strong> <strong>de</strong> <strong>Santa</strong> <strong>Catarina</strong> >> <strong>2001</strong>-<strong>2002</strong><br />
39


