

SÃntese Anual da Agricultura de Santa Catarina - 2001-2002 - Cepa
SÃntese Anual da Agricultura de Santa Catarina - 2001-2002 - Cepa
SÃntese Anual da Agricultura de Santa Catarina - 2001-2002 - Cepa

You also want an ePaper? Increase the reach of your titles
YUMPU automatically turns print PDFs into web optimized ePapers that Google loves.
mandioca<br />
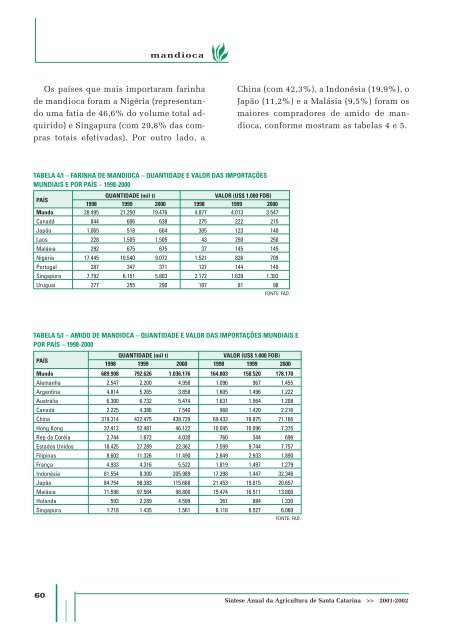
Os países que mais importaram farinha<br />
<strong>de</strong> mandioca foram a Nigéria (representando<br />
uma fatia <strong>de</strong> 46,6% do volume total adquirido)<br />
e Singapura (com 29,8% <strong>da</strong>s compras<br />
totais efetiva<strong>da</strong>s). Por outro lado, a<br />
China (com 42,3%), a Indonésia (19,9%), o<br />
Japão (11,2%) e a Malásia (9,5%) foram os<br />
maiores compradores <strong>de</strong> amido <strong>de</strong> mandioca,<br />
conforme mostram as tabelas 4 e 5.<br />
TABELA 4/I – FARINHA DE MANDIOCA – QUANTIDADE E VALOR DAS IMPORTAÇÕES<br />
MUNDIAIS E POR PAÍS – 1998-2000<br />
PAÍS<br />
QUANTIDADE (mil t)<br />
VALOR (US$ 1.000 FOB)<br />
1998 1999 2000 1998 1999 2000<br />
Mundo 28.495 21.250 19.476 4.877 4.013 3.547<br />
Canadá 844 606 638 275 222 215<br />
Japão 1.065 518 604 305 123 140<br />
Laos 228 1.505 1.505 43 250 250<br />
Malásia 292 675 675 37 145 145<br />
Nigéria 17.445 10.540 9.072 1.521 826 709<br />
Portugal 287 347 371 127 144 149<br />
Singapura 7.792 6.151 5.803 2.172 1.639 1.393<br />
Uruguai 277 255 290 107 81 98<br />
FONTE: FAO.<br />
TABELA 5/I – AMIDO DE MANDIOCA – QUANTIDADE E VALOR DAS IMPORTAÇÕES MUNDIAIS E<br />
POR PAÍS – 1998-2000<br />
PAÍS<br />
QUANTIDADE (mil t)<br />
VALOR (US$ 1.000 FOB)<br />
1998 1999 2000 1998 1999 2000<br />
Mundo 689.908 792.626 1.036.176 164.803 158.520 178.170<br />
Alemanha 2.547 2.200 4.956 1.096 967 1.455<br />
Argentina 4.814 5.265 3.858 1.605 1.496 1.222<br />
Austrália 6.300 6.732 5.474 1.631 1.564 1.208<br />
Canadá 2.225 4.386 7.540 968 1.420 2.216<br />
China 319.314 422.475 438.729 69.433 78.875 71.166<br />
Hong Kong 37.412 52.481 46.122 10.045 10.096 7.375<br />
Rep <strong>da</strong> Coréia 2.744 1.672 4.030 760 344 696<br />
Estados Unidos 18.425 27.289 22.362 7.599 9.744 7.757<br />
Filipinas 8.602 11.326 11.490 2.849 2.933 1.890<br />
França 4.933 4.316 5.522 1.819 1.497 1.279<br />
Indonésia 81.554 8.300 205.989 17.298 1.447 32.346<br />
Japão 84.754 98.383 115.668 21.453 19.815 20.657<br />
Malásia 71.598 97.564 98.800 15.474 16.511 13.800<br />
Holan<strong>da</strong> 593 2.289 4.599 361 884 1.330<br />
Singapura 1.718 1.435 1.561 6.118 6.527 6.060<br />
FONTE: FAO.<br />
60<br />
Síntese <strong>Anual</strong> <strong>da</strong> <strong>Agricultura</strong> <strong>de</strong> <strong>Santa</strong> <strong>Catarina</strong> >> <strong>2001</strong>-<strong>2002</strong>


