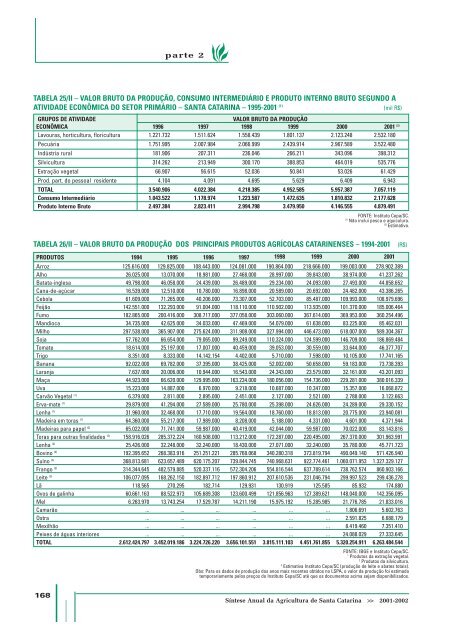
parte 2 TABELA 25/II – VALOR BRUTO DA PRODUÇÃO, CONSUMO INTERMEDIÁRIO E PRODUTO INTERNO BRUTO SEGUNDO A ATIVIDADE ECONÔMICA DO SETOR PRIMÁRIO – SANTA CATARINA – 1995-<strong>2001</strong> (1) (mil R$) GRUPOS DE ATIVIDADE VALOR BRUTO DA PRODUÇÃO ECONÔMICA 1996 1997 1998 1999 2000 <strong>2001</strong> (2) Lavouras, horticultura, floricultura 1.221.732 1.511.624 1.558.439 1.801.137 2.123.248 2.532.180 Pecuária 1.751.995 2.007.984 2.066.999 2.439.914 2.967.589 3.522.480 Indústria rural 181.906 207.311 236.046 266.211 343.096 398.312 Silvicultura 314.262 213.949 300.170 388.853 464.019 535.776 Extração vegetal 66.907 56.615 52.036 50.841 53.026 61.429 Prod. part. do pessoal resi<strong>de</strong>nte 4.104 4.091 4.695 5.629 6.409 6.943 TOTAL 3.540.906 4.022.384 4.218.385 4.952.585 5.957.387 7.057.119 Consumo Intermediário 1.043.522 1.178.974 1.223.587 1.472.635 1.810.832 2.177.628 Produto Interno Bruto 2.497.384 2.823.411 2.994.798 3.479.950 4.146.555 4.879.491 FONTE: Instituto <strong>Cepa</strong>/SC. (1) Não inclui pesca e aquiculura. (2) Estimativa. TABELA 26/II – VALOR BRUTO DA PRODUÇÃO DOS PRINCIPAIS PRODUTOS AGRÍCOLAS CATARINENSES – 1994-<strong>2001</strong> PRODUTOS 1994 1995 1996 1997 1998 1999 2000 <strong>2001</strong> Arroz 125.616.000 129.825.000 108.443.000 124.081.000 190.864.000 218.666.000 199.003.000 278.902.389 Alho 26.025.000 13.070.000 18.981.000 27.468.000 28.997.000 39.843.000 38.974.000 41.237.262 Batata-inglesa 49.798.000 46.058.000 24.439.000 26.489.000 29.234.000 24.093.000 27.493.000 44.858.652 Cana-<strong>de</strong>-açúcar 16.539.000 12.510.000 10.780.000 16.898.000 20.589.000 20.692.000 24.482.000 43.386.265 Cebola 61.609.000 71.265.000 40.206.000 73.307.000 52.703.000 85.487.000 109.993.000 108.979.696 Feijão 142.551.000 132.293.000 91.004.000 118.110.000 110.902.000 113.935.000 101.370.000 185.006.464 Fumo 182.865.000 200.416.000 308.717.000 377.058.000 303.060.000 367.614.000 369.953.000 360.254.496 Mandioca 34.735.000 42.625.000 34.033.000 47.469.000 54.079.000 61.638.000 83.225.000 85.462.031 Milho 297.538.000 365.907.000 275.624.000 311.908.000 327.994.000 446.473.000 618.007.000 589.304.367 Soja 57.762.000 66.654.000 79.065.000 99.249.000 110.324.000 124.599.000 146.709.000 186.869.484 Tomate 18.614.000 25.197.000 17.007.000 40.459.000 39.053.000 30.559.000 33.644.000 46.377.707 Trigo 8.351.000 8.333.000 14.142.154 4.402.000 5.710.000 7.598.000 10.105.000 17.741.165 Banana 92.022.000 69.782.000 37.395.000 38.425.000 52.002.000 50.658.000 59.183.000 73.738.393 Laranja 7.637.000 20.006.000 10.944.000 16.543.000 24.343.000 23.579.000 32.161.000 43.201.093 Maça 44.923.000 66.620.000 129.995.000 163.234.000 180.056.000 154.736.000 229.281.000 380.016.339 Uva 15.223.000 14.887.000 6.970.000 9.218.000 10.687.000 10.347.000 15.357.000 16.068.872 Carvão Vegetal (1) 6.379.000 2.811.000 2.895.000 2.451.000 2.127.000 2.521.000 2.788.000 3.122.663 Erva-mate (1) 29.879.000 41.294.000 27.589.000 25.780.000 25.398.000 24.626.000 24.289.000 29.330.152 Lenha (1) 31.960.000 32.468.000 17.710.000 19.564.000 18.760.000 18.813.000 20.775.000 23.940.081 Ma<strong>de</strong>ira em toras (1) 64.360.000 55.217.000 17.989.000 8.208.000 5.188.000 4.331.000 4.601.000 4.371.944 Ma<strong>de</strong>iras para papel (2) 65.022.000 71.741.000 59.987.000 40.419.000 42.044.000 59.987.000 70.022.000 83.143.816 Toras para outras finali<strong>da</strong><strong>de</strong>s (2) 158.916.026 285.372.224 160.508.000 113.212.000 172.287.000 220.495.000 267.370.000 301.963.991 Lenha (2) 25.426.000 32.248.000 32.240.000 18.430.000 27.071.000 32.240.000 35.780.000 45.771.723 Bovino (3) 192.395.652 268.383.916 251.251.221 285.768.068 340.280.318 373.819.794 490.049.140 571.426.940 Suíno (3) 368.813.681 623.657.489 620.175.207 739.844.745 740.968.631 922.774.461 1.060.071.953 1.327.329.127 Frango (3) 314.344.645 482.579.885 520.337.116 572.304.206 554.816.544 637.789.614 738.762.574 860.903.166 Leite (3) 106.077.095 168.262.150 182.897.712 197.860.912 207.610.536 231.046.794 299.997.523 299.436.278 Lã 118.565 270.295 182.714 129.931 130.919 125.585 85.932 174.880 Ovos <strong>de</strong> galinha 60.661.163 88.522.973 105.689.308 123.600.499 121.856.963 127.389.621 148.040.000 142.356.095 Mel 6.263.970 13.743.254 17.529.787 14.211.190 15.975.192 15.285.985 21.776.785 21.833.016 Camarão ... ... ... ... ... ... 1.806.691 5.602.763 Ostra ... ... ... ... ... ... 2.591.825 6.688.179 Mexilhão ... ... ... ... ... ... 8.419.460 7.351.410 Peixes <strong>de</strong> águas interiores ... ... ... ... ... ... 24.088.029 27.333.645 TOTAL 2.612.424.797 3.452.019.186 3.224.726.220 3.656.101.551 3.815.111.103 4.451.761.855 5.320.254.911 6.263.484.544 FONTE: IBGE e Instituto <strong>Cepa</strong>/SC. 1 Produtos <strong>da</strong> extração vegetal. 2 Produtos <strong>da</strong> silvicultura. 3 Estimativa Instituto <strong>Cepa</strong>/SC (produção <strong>de</strong> leite e abates totais). Obs: Para os <strong>da</strong>dos <strong>de</strong> produção dos anos mais recentes obtidos no LSPA, o valor <strong>da</strong> produção foi estimado temporariamente pelos preços do Instituto <strong>Cepa</strong>/SC até que os documentos acima sejam disponibilizados. (R$) 168 Síntese <strong>Anual</strong> <strong>da</strong> <strong>Agricultura</strong> <strong>de</strong> <strong>Santa</strong> <strong>Catarina</strong> >> <strong>2001</strong>-<strong>2002</strong>
parte 2 TABELA 27/II – ÍNDICE DE PRODUTIVIDADE DAS PRINCIPAIS CULTURAS – SANTA CATARINA – 1987-<strong>2001</strong> (ano base 1985 = 100) PRODUTO ALHO ARROZ BANANA BATATA CEBOLA FEIJÃO FUMO EM MAÇÃ MANDIOCA MILHO SOJA TOMATE TRIGO UVA INGLESA FOLHA 1987 108,71 100,73 97,74 94,80 110,95 77,01 89,62 97,28 120,63 104,88 93,77 112,96 96,26 78,73 1988 80,98 113,02 97,53 99,59 108,48 89,76 97,50 106,12 125,55 104,74 93,35 111,36 56,02 106,98 1989 108,65 113,88 91,54 98,43 87,94 92,16 95,99 114,33 129,27 116,54 112,26 127,02 100,13 106,38 1990 94,95 120,43 98,15 107,62 111,47 86,65 101,72 133,38 128,63 115,03 108,22 130,59 77,59 114,85 1991 96,82 130,91 97,35 95,07 110,63 62,60 96,02 108,17 129,84 63,02 69,38 128,31 98,93 78,47 1992 112,64 147,89 115,94 104,60 107,38 126,43 102,53 137,20 134,12 130,88 133,34 115,11 114,29 107,36 1993 122,45 132,44 124,81 118,73 107,42 110,11 100,91 178,47 134,90 136,95 147,25 153,12 98,49 112,82 1994 101,47 143,89 126,93 118,42 114,32 127,54 102,13 128,77 131,78 140,03 148,95 160,23 93,62 103,50 1995 103,98 147,94 103,41 110,54 106,72 108,03 94,23 135,87 135,68 150,09 161,82 152,42 113,37 98,61 1996 88,47 150,56 92,83 114,67 96,43 112,09 90,92 173,76 80,72 132,76 180,24 92,76 112,97 71,26 1997 100,29 160,59 112,82 110,33 108,73 124,45 107,70 189,66 116,73 156,79 179,03 147,69 72,40 92,42 1998 127,54 173,59 122,67 111,67 114,68 87,15 78,87 182,06 121,29 146,79 175,37 154,22 114,17 88,85 1999 135,80 194,26 131,79 110,47 165,39 105,70 109,07 186,87 134,39 150,23 159,31 149,78 141,63 83,04 2000 147,04 191,50 140,53 122,77 194,62 141,20 110,18 144,13 134,31 179,79 184,04 147,80 136,23 102,65 <strong>2001</strong> 146,95 210,96 137,45 131,84 161,01 150,47 106,97 172,64 139,63 196,20 200,20 154,64 121,33 93,87 FONTE: Instituto <strong>Cepa</strong>/SC. PREÇOS AGRÍCOLAS TABELA 28/II – PREÇOS MÍNIMOS VIGENTES, POR PRODUTO, NA REGIÃO CENTRO-SUL – 1998-<strong>2002</strong> (R$) ARROZ ARROZ FEIJÃO SOJA MILHO TRIGO MANDIOCA FARINHA DE FÉCULA DE ANO MÊS IRRIGADO SEQUEIRO (sc 60 kg) (sc 60 kg) (sc 60 kg) (t) (raiz) MANDIOCA MANDIOCA (sc 50 kg) (sc 60 kg) (t) (50 kg) (kg) Jan 10,53 9,30 26,00 8,88 6,70 157,00 25,00 7,70 0,229 Fev 10,53 9,30 26,00 9,50 6,70 157,00 25,00 7,70 0,229 Mar 10,53 9,30 26,00 9,50 6,70 157,00 25,00 7,70 0,229 Abr 10,53 9,30 26,00 9,50 6,70 157,00 25,00 7,70 0,229 Mai 10,53 9,30 26,00 9,50 6,70 157,00 25,00 7,70 0,229 1998 Jun 10,53 9,30 26,00 9,50 6,70 157,00 25,00 7,70 0,229 Jul 10,53 9,30 26,00 9,50 6,70 157,00 25,00 7,70 0,229 Ago 10,53 9,30 26,00 9,50 6,70 157,00 25,00 7,70 0,229 Set 10,53 9,30 26,00 9,50 6,70 157,00 25,00 7,70 0,229 Out 10,53 9,30 26,00 9,50 6,70 157,00 25,00 7,70 0,229 Nov 10,53 9,30 26,00 9,50 6,70 157,00 25,00 7,70 0,229 Dez 10,53 9,30 26,00 9,50 6,70 157,00 25,00 7,70 0,229 Jan 10,53 9,30 26,00 9,50 6,70 157,00 25,00 7,70 0,229 Fev 10,53 9,30 26,00 9,50 6,70 157,00 25,00 7,70 0,229 Mar 10,53 9,30 26,00 9,50 6,70 157,00 25,00 7,70 0,229 Abr 10,53 9,30 26,00 9,50 6,70 157,00 25,00 7,70 0,229 Mai 10,53 9,30 26,00 9,50 6,70 157,00 25,00 7,70 0,229 1999 Jun 10,53 9,30 26,00 9,50 6,70 157,00 25,00 7,70 0,229 Jul 10,53 9,30 26,00 9,50 6,70 157,00 25,00 7,70 0,229 Ago 10,53 9,30 26,00 9,50 6,70 185,00 25,00 7,70 0,229 Set 10,53 9,30 26,00 9,50 6,70 185,00 25,00 7,70 0,229 Out 10,53 9,30 26,00 9,50 6,70 185,00 25,00 7,70 0,229 Nov 10,53 9,30 28,00 9,50 6,70 185,00 25,00 7,70 0,229 Dez 10,53 9,30 28,00 9,50 6,70 185,00 25,00 7,70 0,229 (continua) Síntese <strong>Anual</strong> <strong>da</strong> <strong>Agricultura</strong> <strong>de</strong> <strong>Santa</strong> <strong>Catarina</strong> >> <strong>2001</strong>-<strong>2002</strong> 169
- Page 2 and 3:
INSTITUTO DE PLANEJAMENTO E ECONOMI
- Page 4 and 5:
apresentação Oestado de Santa Cat
- Page 6 and 7:
sumário DESEMPENHO DA PESCA ......
- Page 8 and 9:
Parte 1 A CONJUNTURA ECONÔMICA EM
- Page 10 and 11:
do. As responsabilidades pelos risc
- Page 12 and 13:
A pecuária participa com pouco mai
- Page 14 and 15:
crescentes, não foram suficientes
- Page 16 and 17:
AS REGRAS PARA A SAFRA 02/03 Em 24
- Page 18 and 19:
as regras para a safra 02/03 mento
- Page 20 and 21:
Desempenho da produção vegetal AL
- Page 22 and 23:
Santa Catarina continua sendo o seg
- Page 24 and 25:
arroz Em termos de rendimento, por
- Page 26 and 27:
arroz TABELA 4/I - ARROZ EM CASCA -
- Page 28 and 29:
BANANA Dentre as frutas cultivadas
- Page 30 and 31:
anana TABELA 2/I - BANANA - ÁREA P
- Page 32 and 33:
anana forma, retardou a recuperaç
- Page 34 and 35:
atata TABELA 1/I - BATATA - ÁREA P
- Page 36 and 37:
CEBOLA Os dados de desempenho da ce
- Page 38 and 39:
cebola GRÁFICO 3/I - CEBOLA - COMP
- Page 40 and 41:
FEIJÃO Produção mundial estabili
- Page 42 and 43:
feijão TABELA 3/I - FEIJÃO - PROD
- Page 44 and 45:
feijão expectativa de níveis elev
- Page 46 and 47:
feijão clínio de produtividade (-
- Page 48 and 49:
feijão Estes números expressam:
- Page 50 and 51:
feijão TABELA 11/I - FEIJÃO 2ª S
- Page 52 and 53:
fumo Safra 01/02 - Situação do Su
- Page 54 and 55:
fumo parte do seu custo de produç
- Page 56 and 57:
MAÇÃ Aprodução brasileira de ma
- Page 58 and 59:
potencial produtivo dos pomares já
- Page 60 and 61:
mandioca Os países que mais import
- Page 62 and 63:
mandioca se negativamente nos valor
- Page 64 and 65:
No Litoral Sul Catarinense, os pre
- Page 66 and 67:
mandioca / milho Perspectivas As pe
- Page 68 and 69:
milho Entretanto, a perspectiva de
- Page 70 and 71:
milho A perspectiva inicial de um s
- Page 72 and 73:
milho TABELA 6/I - MILHO - ÁREA PL
- Page 74 and 75:
soja Unidos, o mercado voltou a sub
- Page 76 and 77:
soja (R$/sc) GRÁFICO 5/I - SOJA -
- Page 78 and 79:
TOMATE Otomate é uma das mais impo
- Page 80 and 81:
tomate portante no contexto naciona
- Page 82 and 83:
quando a área plantada foi 5,5% ma
- Page 84 and 85:
trigo TABELA 7/I - TRIGO - OFERTA E
- Page 86 and 87:
trigo TABELA 13/I - TRIGO - PREÇOS
- Page 88 and 89:
uva GRÁFICO 1/I - UVA - PARTICIPA
- Page 90 and 91:
FLORES E PLANTAS ORNAMENTAIS Situa
- Page 92 and 93:
30,9%; floricultura-terceiros - 20,
- Page 94 and 95:
flores e plantas ornamentais lizado
- Page 96 and 97:
calendário agrícola QUADRO 1/I -
- Page 98 and 99:
carne de frango Panorama catarinens
- Page 100 and 101:
carne bovina GRÁFICO 2/I - CARNE B
- Page 102 and 103:
carne suína A produção catarinen
- Page 104 and 105:
carne suína / leite TABELA 3/I - A
- Page 106 and 107:
leite Dentre os outros países com
- Page 108 and 109:
leite TABELA 4/I - LEITE - PRODUÇ
- Page 110 and 111:
leite TABELA 10/I - LEITE E DERIVAD
- Page 112 and 113:
leite TABELA 14/I - LEITE - PREÇOS
- Page 114 and 115:
mel TABELA 1/I - MEL - QUANTIDADE T
- Page 116 and 117:
mel TABELA 5/I - MEL - VALOR DAS IM
- Page 118 and 119: mel expressiva, usada mais para fin
- Page 120 and 121: mel QUADRO 1/I - MEL - CALENDÁRIO
- Page 122 and 123: Desempenho da pesca PESCA No Brasil
- Page 124 and 125: pesca GRÁFICO 1/I - PESCADO - IMPO
- Page 126 and 127: pesca Laguna vêm a seguir, com uma
- Page 128 and 129: Desempenho da aqüicultura AQÜICUL
- Page 130 and 131: piscicultura e garantindo a compra
- Page 132 and 133: CAMARÃO MARINHO Acarcinicultura, n
- Page 134 and 135: camarão marinho As exportações c
- Page 136 and 137: moluscos GRÁFICO 1/I - PRODUÇÃO
- Page 138 and 139: DESEMPENHO DO SETOR FLORESTAL Panor
- Page 140 and 141: setor florestal quase todas as regi
- Page 142 and 143: O Brasil tem uma posição importan
- Page 144 and 145: setor florestal ção, do consumo e
- Page 146 and 147: setor florestal A produção catari
- Page 148 and 149: setor florestal portado pelos três
- Page 150 and 151: setor florestal de madeiras, desenv
- Page 152 and 153: parte 2 Continuação MUNICíPIO Á
- Page 154 and 155: ARGENTINA Dionísio Cerqueira Guaru
- Page 156 and 157: parte 2 TABELA 4/II - UMIDADE RELAT
- Page 158 and 159: parte 2 TABELA 8/II - POPULAÇÃO R
- Page 160 and 161: parte 2 Conclusão MUNICÍPIO POPUL
- Page 162 and 163: parte 2 ESTRUTURA DE PRODUÇÃO E C
- Page 164 and 165: parte 2 TABELA 17/II - MÁQUINAS AG
- Page 166 and 167: parte 2 TABELA 23/II - EXPORTAÇÕE
- Page 170 and 171: parte 2 (conclusão) ANO MÊS ARROZ
- Page 172 and 173: parte 2 TABELA 30/II - PREÇOS MÉD
- Page 174 and 175: parte 2 TABELA 32/II - PREÇOS MÉD
- Page 176 and 177: parte 2 TABELA 34/II - EQUIVALÊNCI
- Page 178 and 179: anexo I Catanduvas Erval Velho MESO
- Page 180 and 181: anexo II São Bonifácio ASSOCIAÇ
- Page 182 and 183: anexo II / anexo III ASSOCIAÇÃO D
- Page 184 and 185: anexo III REGIÃO HIDROGRÁFICA BAC
- Page 186 and 187: anexo III RH-6 BAIXADA NORTE RIO CU
- Page 188 and 189: anexo III REGIÃO HIDROGRÁFICA BAC
- Page 190 and 191: anexo IV Produto - Resultado de qua
- Page 192 and 193: LISTA DE GRÁFICOS ALHO 1. Preços
- Page 194 and 195: lista de gráficos CARNE BOVINA 1.
- Page 196 and 197: LISTA DE TABELAS A CONJUNTURA ECON
- Page 198 and 199: lista de tabelas 7. Exportações c
- Page 200 and 201: lista de tabelas DESEMPENHO DA PROD
- Page 202 and 203: lista de tabelas 4. Produção mund
- Page 204: ÍNDICE REMISSIVO Alho, 20-23 Aqüi