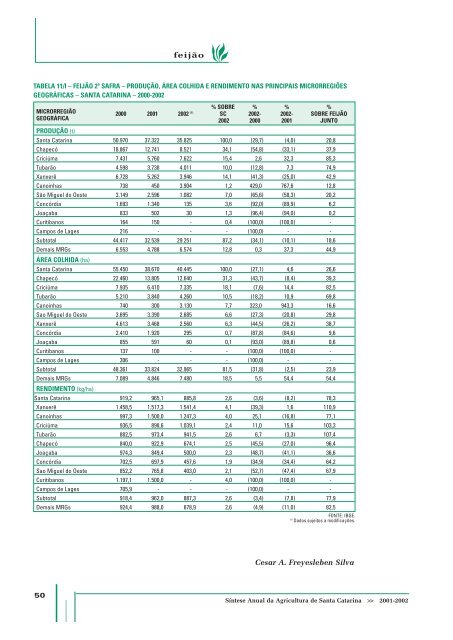
feijão TABELA 11/I – FEIJÃO 2ª SAFRA – PRODUÇÃO, ÁREA COLHIDA E RENDIMENTO NAS PRINCIPAIS MICRORREGIÕES GEOGRÁFICAS – SANTA CATARINA – 2000-<strong>2002</strong> % SOBRE % % % MICRORREGIÃO 2000 <strong>2001</strong> <strong>2002</strong> (1) SC <strong>2002</strong>- <strong>2002</strong>- SOBRE FEIJÃO GEOGRÁFICA <strong>2002</strong> 2000 <strong>2001</strong> JUNTO PRODUÇÃO (t) <strong>Santa</strong> <strong>Catarina</strong> 50.970 37.322 35.825 100,0 (29,7) (4,0) 20,8 Chapecó 18.867 12.741 8.521 34,1 (54,8) (33,1) 37,9 Criciúma 7.431 5.760 7.622 15,4 2,6 32,3 85,3 Tubarão 4.598 3.738 4.011 10,0 (12,8) 7,3 74,9 Xanxerê 6.728 5.262 3.946 14,1 (41,3) (25,0) 42,9 Canoinhas 738 450 3.904 1,2 429,0 767,6 12,8 São Miguel do Oeste 3.149 2.596 1.082 7,0 (65,6) (58,3) 20,2 Concórdia 1.693 1.340 135 3,6 (92,0) (89,9) 6,2 Joaçaba 833 502 30 1,3 (96,4) (94,0) 0,2 Curitibanos 164 150 - 0,4 (100,0) (100,0) - Campos <strong>de</strong> Lages 216 - - - (100,0) - - Subtotal 44.417 32.539 29.251 87,2 (34,1) (10,1) 18,6 Demais MRGs 6.553 4.788 6.574 12,8 0,3 37,3 44,9 ÁREA COLHIDA (ha) <strong>Santa</strong> <strong>Catarina</strong> 55.450 38.670 40.445 100,0 (27,1) 4,6 26,6 Chapecó 22.460 13.805 12.640 31,3 (43,7) (8,4) 39,3 Criciúma 7.935 6.410 7.335 18,1 (7,6) 14,4 82,5 Tubarão 5.210 3.840 4.260 10,5 (18,2) 10,9 69,8 Canoinhas 740 300 3.130 7,7 323,0 943,3 16,6 Sao Miguel do Oeste 3.695 3.390 2.685 6,6 (27,3) (20,8) 29,8 Xanxerê 4.613 3.468 2.560 6,3 (44,5) (26,2) 38,7 Concórdia 2.410 1.920 295 0,7 (87,8) (84,6) 9,6 Joaçaba 855 591 60 0,1 (93,0) (89,8) 0,6 Curitibanos 137 100 - - (100,0) (100,0) - Campos <strong>de</strong> Lages 306 - - - (100,0) - - Subtotal 48.361 33.824 32.965 81,5 (31,8) (2,5) 23,9 Demais MRGs 7.089 4.846 7.480 18,5 5,5 54,4 54,4 RENDIMENTO (kg/ha) <strong>Santa</strong> <strong>Catarina</strong> 919,2 965,1 885,8 2,6 (3,6) (8,2) 78,3 Xanxerê 1.458,5 1.517,3 1.541,4 4,1 (39,3) 1,6 110,9 Canoinhas 997,3 1.500,0 1.247,3 4,0 25,1 (16,8) 77,1 Criciúma 936,5 898,6 1.039,1 2,4 11,0 15,6 103,3 Tubarão 882,5 973,4 941,5 2,6 6,7 (3,3) 107,4 Chapecó 840,0 922,9 674,1 2,5 (45,5) (27,0) 96,4 Joaçaba 974,3 849,4 500,0 2,3 (48,7) (41,1) 36,6 Concórdia 702,5 697,9 457,6 1,9 (34,9) (34,4) 64,2 Sao Miguel do Oeste 852,2 765,8 403,0 2,1 (52,7) (47,4) 67,9 Curitibanos 1.197,1 1.500,0 - 4,0 (100,0) (100,0) - Campos <strong>de</strong> Lages 705,9 - - - (100,0) - - Subtotal 918,4 962,0 887,3 2,6 (3,4) (7,8) 77,9 Demais MRGs 924,4 988,0 878,9 2,6 (4,9) (11,0) 82,5 FONTE: IBGE. (1) Dados sujeitos a modificações. Cesar A. Freyesleben Silva 50 Síntese <strong>Anual</strong> <strong>da</strong> <strong>Agricultura</strong> <strong>de</strong> <strong>Santa</strong> <strong>Catarina</strong> >> <strong>2001</strong>-<strong>2002</strong>
FUMO OBrasil ocupa papel <strong>de</strong> <strong>de</strong>staque na produção e no mercado internacional <strong>de</strong> fumo. É o terceiro produtor e primeiro exportador mundial <strong>de</strong>sse produto em folha. A fumicultura brasileira <strong>de</strong>pen<strong>de</strong> muito do comportamento <strong>da</strong>s exportações, já que entre 60% e 70% <strong>da</strong> produção tem como <strong>de</strong>stino o mercado externo. Assim, a produção nacional tem variado para mais ou para menos <strong>de</strong>pen<strong>de</strong>ndo, sobretudo, <strong>da</strong>s condições do mercado internacional. Nos últimos anos, como o Brasil ampliou o seu espaço no mercado internacional, a produção brasileira tem sido crescente. Essa maior participação brasileira é <strong>de</strong>corrente, principalmente, dos seguintes fatores: sensíveis reduções na produção e nos estoques mundiais; per<strong>da</strong> <strong>de</strong> competitivi<strong>da</strong><strong>de</strong> <strong>da</strong>s exportações dos Estados Unidos e do Zimbábue; agressivi<strong>da</strong><strong>de</strong> <strong>da</strong>s indústrias brasileiras no mercado internacional; competitivi<strong>da</strong><strong>de</strong> do preço e <strong>da</strong> quali<strong>da</strong><strong>de</strong> do fumo nacional em relação aos <strong>de</strong> outros importantes exportadores mundiais. TABELA 1/I – FUMO – PRODUÇÃO, EXPORTAÇÃO, IMPORTAÇÃO, CONSUMO E ESTOQUE FINAL, MUNDIAL E DOS PRINCIPAIS PAÍSES – 1998-<strong>2002</strong> (mil t <strong>de</strong> peso seco) DISCRIMINAÇÃO 1998 1999 2000 <strong>2001</strong> <strong>2002</strong> (1) Produção Mundial 5.927,78 5.974,27 5.987,48 5.591,90 5.585,88 China 2.010,25 2.098,91 2.169,20 1.997,18 1.979,63 Índia 572,20 587,60 599,40 530,00 575,00 Brasil 373,15 498,40 493,10 454,90 454,90 Estados Unidos 604,13 527,72 408,20 400,27 372,41 Zimbábue 192,38 170,94 210,69 172,11 172,11 Indonésia 123,65 133,35 157,05 157,34 157,34 Exportação Mundial 1.928,65 2.070,60 1.961,54 2.026,74 2.006,60 Brasil 300,50 343,00 341,50 354,90 354,90 Estados Unidos 211,92 191,98 179,89 185,83 190,00 Zimbábue 168,80 199,24 182,07 185,00 185,00 China 92,17 113,26 113,01 139,92 118,93 Itália 98,18 93,90 100,61 109,52 105,00 Índia 81,79 119,64 123,19 85,50 105,00 Importação Mundial 1.913,01 2.025,81 1.969,68 2.050,30 2.080,64 Rússia 200,90 264,67 285,00 307,50 307,50 Estados Unidos 246,76 241,07 196,60 254,38 270,00 Alemanha 222,59 266,98 263,08 247,07 257,00 Reino Unido 149,76 137,18 108,43 102,67 119,00 Japão 101,44 98,92 93,93 92,43 91,00 Países Baixos 84,81 84,86 79,99 75,99 75,99 Consumo Mundial 6.358,98 5.468,74 6.440,11 6.437,32 6.488,12 China 2.342,22 1.443,57 2.542,06 2.601,35 2.633,31 Estados Unidos 616,84 572,70 498,91 483,91 500,00 Índia 483,36 478,35 474,28 471,95 476,13 Rússia 180,46 265,70 301,48 308,51 309,30 Alemanha 142,65 170,04 175,30 177,79 180,00 Indonésia 133,30 153,59 174,61 169,40 169,40 Estoque final Mundial 6.720,00 7.179,75 6.732,71 5.910,86 5.082,05 China 2.787,48 3.340,03 2.892,00 2.204,60 1.491,63 Estados Unidos 1.605,89 1.610,00 1.536,00 1.520,91 1.473,32 Turquia 311,01 329,50 380,82 392,43 371,02 Brasil 162,95 212,13 266,98 264,93 262,88 Japão 272,70 247,50 231,11 225,26 220,46 Itália 140,92 151,46 150,80 139,07 133,91 FONTE: Us<strong>da</strong> (Junho/<strong>2002</strong>). (1) Estimativa. Síntese <strong>Anual</strong> <strong>da</strong> <strong>Agricultura</strong> <strong>de</strong> <strong>Santa</strong> <strong>Catarina</strong> >> <strong>2001</strong>-<strong>2002</strong> 51
- Page 2 and 3: INSTITUTO DE PLANEJAMENTO E ECONOMI
- Page 4 and 5: apresentação Oestado de Santa Cat
- Page 6 and 7: sumário DESEMPENHO DA PESCA ......
- Page 8 and 9: Parte 1 A CONJUNTURA ECONÔMICA EM
- Page 10 and 11: do. As responsabilidades pelos risc
- Page 12 and 13: A pecuária participa com pouco mai
- Page 14 and 15: crescentes, não foram suficientes
- Page 16 and 17: AS REGRAS PARA A SAFRA 02/03 Em 24
- Page 18 and 19: as regras para a safra 02/03 mento
- Page 20 and 21: Desempenho da produção vegetal AL
- Page 22 and 23: Santa Catarina continua sendo o seg
- Page 24 and 25: arroz Em termos de rendimento, por
- Page 26 and 27: arroz TABELA 4/I - ARROZ EM CASCA -
- Page 28 and 29: BANANA Dentre as frutas cultivadas
- Page 30 and 31: anana TABELA 2/I - BANANA - ÁREA P
- Page 32 and 33: anana forma, retardou a recuperaç
- Page 34 and 35: atata TABELA 1/I - BATATA - ÁREA P
- Page 36 and 37: CEBOLA Os dados de desempenho da ce
- Page 38 and 39: cebola GRÁFICO 3/I - CEBOLA - COMP
- Page 40 and 41: FEIJÃO Produção mundial estabili
- Page 42 and 43: feijão TABELA 3/I - FEIJÃO - PROD
- Page 44 and 45: feijão expectativa de níveis elev
- Page 46 and 47: feijão clínio de produtividade (-
- Page 48 and 49: feijão Estes números expressam:
- Page 52 and 53: fumo Safra 01/02 - Situação do Su
- Page 54 and 55: fumo parte do seu custo de produç
- Page 56 and 57: MAÇÃ Aprodução brasileira de ma
- Page 58 and 59: potencial produtivo dos pomares já
- Page 60 and 61: mandioca Os países que mais import
- Page 62 and 63: mandioca se negativamente nos valor
- Page 64 and 65: No Litoral Sul Catarinense, os pre
- Page 66 and 67: mandioca / milho Perspectivas As pe
- Page 68 and 69: milho Entretanto, a perspectiva de
- Page 70 and 71: milho A perspectiva inicial de um s
- Page 72 and 73: milho TABELA 6/I - MILHO - ÁREA PL
- Page 74 and 75: soja Unidos, o mercado voltou a sub
- Page 76 and 77: soja (R$/sc) GRÁFICO 5/I - SOJA -
- Page 78 and 79: TOMATE Otomate é uma das mais impo
- Page 80 and 81: tomate portante no contexto naciona
- Page 82 and 83: quando a área plantada foi 5,5% ma
- Page 84 and 85: trigo TABELA 7/I - TRIGO - OFERTA E
- Page 86 and 87: trigo TABELA 13/I - TRIGO - PREÇOS
- Page 88 and 89: uva GRÁFICO 1/I - UVA - PARTICIPA
- Page 90 and 91: FLORES E PLANTAS ORNAMENTAIS Situa
- Page 92 and 93: 30,9%; floricultura-terceiros - 20,
- Page 94 and 95: flores e plantas ornamentais lizado
- Page 96 and 97: calendário agrícola QUADRO 1/I -
- Page 98 and 99: carne de frango Panorama catarinens
- Page 100 and 101:
carne bovina GRÁFICO 2/I - CARNE B
- Page 102 and 103:
carne suína A produção catarinen
- Page 104 and 105:
carne suína / leite TABELA 3/I - A
- Page 106 and 107:
leite Dentre os outros países com
- Page 108 and 109:
leite TABELA 4/I - LEITE - PRODUÇ
- Page 110 and 111:
leite TABELA 10/I - LEITE E DERIVAD
- Page 112 and 113:
leite TABELA 14/I - LEITE - PREÇOS
- Page 114 and 115:
mel TABELA 1/I - MEL - QUANTIDADE T
- Page 116 and 117:
mel TABELA 5/I - MEL - VALOR DAS IM
- Page 118 and 119:
mel expressiva, usada mais para fin
- Page 120 and 121:
mel QUADRO 1/I - MEL - CALENDÁRIO
- Page 122 and 123:
Desempenho da pesca PESCA No Brasil
- Page 124 and 125:
pesca GRÁFICO 1/I - PESCADO - IMPO
- Page 126 and 127:
pesca Laguna vêm a seguir, com uma
- Page 128 and 129:
Desempenho da aqüicultura AQÜICUL
- Page 130 and 131:
piscicultura e garantindo a compra
- Page 132 and 133:
CAMARÃO MARINHO Acarcinicultura, n
- Page 134 and 135:
camarão marinho As exportações c
- Page 136 and 137:
moluscos GRÁFICO 1/I - PRODUÇÃO
- Page 138 and 139:
DESEMPENHO DO SETOR FLORESTAL Panor
- Page 140 and 141:
setor florestal quase todas as regi
- Page 142 and 143:
O Brasil tem uma posição importan
- Page 144 and 145:
setor florestal ção, do consumo e
- Page 146 and 147:
setor florestal A produção catari
- Page 148 and 149:
setor florestal portado pelos três
- Page 150 and 151:
setor florestal de madeiras, desenv
- Page 152 and 153:
parte 2 Continuação MUNICíPIO Á
- Page 154 and 155:
ARGENTINA Dionísio Cerqueira Guaru
- Page 156 and 157:
parte 2 TABELA 4/II - UMIDADE RELAT
- Page 158 and 159:
parte 2 TABELA 8/II - POPULAÇÃO R
- Page 160 and 161:
parte 2 Conclusão MUNICÍPIO POPUL
- Page 162 and 163:
parte 2 ESTRUTURA DE PRODUÇÃO E C
- Page 164 and 165:
parte 2 TABELA 17/II - MÁQUINAS AG
- Page 166 and 167:
parte 2 TABELA 23/II - EXPORTAÇÕE
- Page 168 and 169:
parte 2 TABELA 25/II - VALOR BRUTO
- Page 170 and 171:
parte 2 (conclusão) ANO MÊS ARROZ
- Page 172 and 173:
parte 2 TABELA 30/II - PREÇOS MÉD
- Page 174 and 175:
parte 2 TABELA 32/II - PREÇOS MÉD
- Page 176 and 177:
parte 2 TABELA 34/II - EQUIVALÊNCI
- Page 178 and 179:
anexo I Catanduvas Erval Velho MESO
- Page 180 and 181:
anexo II São Bonifácio ASSOCIAÇ
- Page 182 and 183:
anexo II / anexo III ASSOCIAÇÃO D
- Page 184 and 185:
anexo III REGIÃO HIDROGRÁFICA BAC
- Page 186 and 187:
anexo III RH-6 BAIXADA NORTE RIO CU
- Page 188 and 189:
anexo III REGIÃO HIDROGRÁFICA BAC
- Page 190 and 191:
anexo IV Produto - Resultado de qua
- Page 192 and 193:
LISTA DE GRÁFICOS ALHO 1. Preços
- Page 194 and 195:
lista de gráficos CARNE BOVINA 1.
- Page 196 and 197:
LISTA DE TABELAS A CONJUNTURA ECON
- Page 198 and 199:
lista de tabelas 7. Exportações c
- Page 200 and 201:
lista de tabelas DESEMPENHO DA PROD
- Page 202 and 203:
lista de tabelas 4. Produção mund
- Page 204:
ÍNDICE REMISSIVO Alho, 20-23 Aqüi