SÃntese Anual da Agricultura de Santa Catarina - 2001-2002 - Cepa
SÃntese Anual da Agricultura de Santa Catarina - 2001-2002 - Cepa
SÃntese Anual da Agricultura de Santa Catarina - 2001-2002 - Cepa
You also want an ePaper? Increase the reach of your titles
YUMPU automatically turns print PDFs into web optimized ePapers that Google loves.
trigo<br />
em relação ao período 01/02 o <strong>de</strong>créscimo na<br />
produção seja pequeno, é bastante significativo<br />
quando se consi<strong>de</strong>ram os últimos anos.<br />
Terceiro, no caso <strong>de</strong> outros importantes<br />
produtores e exportadores mundiais, como a<br />
Austrália, o Canadá e a Argentina, o Us<strong>da</strong> está<br />
prevendo crescimento na produção em relação<br />
à do período anterior.<br />
Em relação à Argentina, permanecem dúvi<strong>da</strong>s<br />
acerca <strong>de</strong>sta tendência. Enquanto o Us<strong>da</strong><br />
estima um pequeno crescimento na área<br />
<strong>de</strong> plantio neste país, em face <strong>de</strong> seus proble-<br />
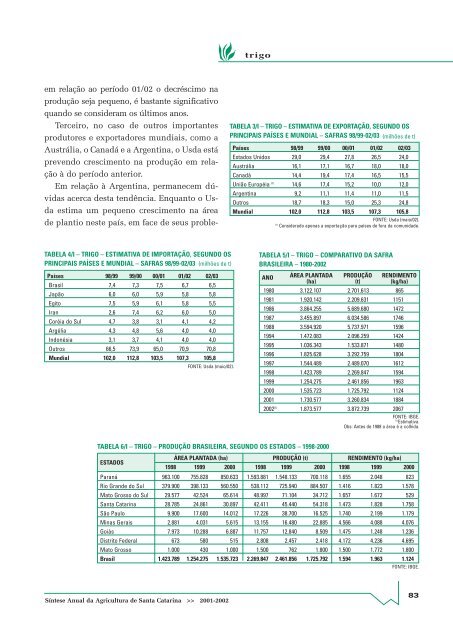
TABELA 3/I – TRIGO – ESTIMATIVA DE EXPORTAÇÃO, SEGUNDO OS<br />
PRINCIPAIS PAÍSES E MUNDIAL – SAFRAS 98/99-02/03 (milhões <strong>de</strong> t)<br />
Países 98/99 99/00 00/01 01/02 02/03<br />
Estados Unidos 29,0 29,4 27,8 26,5 24,0<br />
Austrália 16,1 17,1 16,7 18,0 18,0<br />
Canadá 14,4 19,4 17,4 16,5 15,5<br />
União Européia (1) 14,6 17,4 15,2 10,0 12,0<br />
Argentina 9,2 11,1 11,4 11,0 11,5<br />
Outros 18,7 18,3 15,0 25,3 24,8<br />
Mundial 102,0 112,8 103,5 107,3 105,8<br />
FONTE: Us<strong>da</strong> (maio/02).<br />
(1)<br />
Consi<strong>de</strong>rado apenas a exportação para países <strong>de</strong> fora <strong>da</strong> comuni<strong>da</strong><strong>de</strong>.<br />
TABELA 4/I – TRIGO – ESTIMATIVA DE IMPORTAÇÃO, SEGUNDO OS<br />
PRINCIPAIS PAÍSES E MUNDIAL – SAFRAS 98/99-02/03 (milhões <strong>de</strong> t)<br />
Países 98/99 99/00 00/01 01/02 02/03<br />
Brasil 7,4 7,3 7,5 6,7 6,5<br />
Japão 6,0 6,0 5,9 5,8 5,8<br />
Egito 7,5 5,9 6,1 5,8 5,5<br />
Iran 2,6 7,4 6,2 6,0 5,0<br />
Coréia do Sul 4,7 3,8 3,1 4,1 4,2<br />
Argélia 4,3 4,8 5,6 4,0 4,0<br />
Indonésia 3,1 3,7 4,1 4,0 4,0<br />
Outros 66,5 73,9 65,0 70,9 70,8<br />
Mundial 102,0 112,8 103,5 107,3 105,8<br />
FONTE: Us<strong>da</strong> (maio/02).<br />
TABELA 5/I – TRIGO – COMPARATIVO DA SAFRA<br />
BRASILEIRA – 1980-<strong>2002</strong><br />
ANO ÁREA PLANTADA<br />
(ha)<br />
PRODUÇÃO<br />
(t)<br />
RENDIMENTO<br />
(kg/ha)<br />
1980 3.122.107 2.701.613 865<br />
1981 1.920.142 2.209.631 1151<br />
1986 3.864.255 5.689.680 1472<br />
1987 3.455.897 6.034.586 1746<br />
1988 3.594.920 5.737.971 1596<br />
1994 1.472.083 2.096.259 1424<br />
1995 1.036.343 1.533.871 1480<br />
1996 1.825.628 3.292.759 1804<br />
1997 1.544.489 2.489.070 1612<br />
1998 1.423.789 2.269.847 1594<br />
1999 1.254.275 2.461.856 1963<br />
2000 1.535.723 1.725.792 1124<br />
<strong>2001</strong> 1.730.577 3.260.834 1884<br />
<strong>2002</strong> (1) 1.873.577 3.872.739 2067<br />
FONTE: IBGE.<br />
(1)<br />
Estimativa.<br />
Obs: Antes <strong>de</strong> 1988 a área é a colhi<strong>da</strong>.<br />
TABELA 6/I – TRIGO – PRODUÇÃO BRASILEIRA, SEGUNDO OS ESTADOS – 1998-2000<br />
ESTADOS<br />
ÁREA PLANTADA (ha) PRODUÇÃO (t) RENDIMENTO (kg/ha)<br />
1998 1999 2000 1998 1999 2000 1998 1999 2000<br />
Paraná 963.100 755.828 850.633 1.593.881 1.548.133 700.118 1.655 2.048 823<br />
Rio Gran<strong>de</strong> do Sul 379.900 398.133 560.550 538.112 725.940 884.507 1.416 1.823 1.578<br />
Mato Grosso do Sul 29.577 42.524 65.614 48.997 71.104 34.712 1.657 1.672 529<br />
<strong>Santa</strong> <strong>Catarina</strong> 28.785 24.861 30.897 42.411 45.440 54.318 1.473 1.828 1.758<br />
São Paulo 9.900 17.600 14.012 17.226 38.700 16.525 1.740 2.199 1.179<br />
Minas Gerais 2.881 4.031 5.615 13.155 16.480 22.885 4.566 4.088 4.076<br />
Goiás 7.973 10.288 6.887 11.757 12.840 8.509 1.475 1.248 1.236<br />
Distrito Fe<strong>de</strong>ral 673 580 515 2.808 2.457 2.418 4.172 4.236 4.695<br />
Mato Grosso 1.000 430 1.000 1.500 762 1.800 1.500 1.772 1.800<br />
Brasil 1.423.789 1.254.275 1.535.723 2.269.847 2.461.856 1.725.792 1.594 1.963 1.124<br />
FONTE: IBGE.<br />
Síntese <strong>Anual</strong> <strong>da</strong> <strong>Agricultura</strong> <strong>de</strong> <strong>Santa</strong> <strong>Catarina</strong> >> <strong>2001</strong>-<strong>2002</strong><br />
83


