

SÃntese Anual da Agricultura de Santa Catarina - 2001-2002 - Cepa
SÃntese Anual da Agricultura de Santa Catarina - 2001-2002 - Cepa
SÃntese Anual da Agricultura de Santa Catarina - 2001-2002 - Cepa

You also want an ePaper? Increase the reach of your titles
YUMPU automatically turns print PDFs into web optimized ePapers that Google loves.
atata<br />
significa que durante praticamente todo o<br />
transcorrer <strong>de</strong>ste ano mostraram-se fortemente<br />
majorados em relação aos valores registrados<br />
no ano passado.<br />
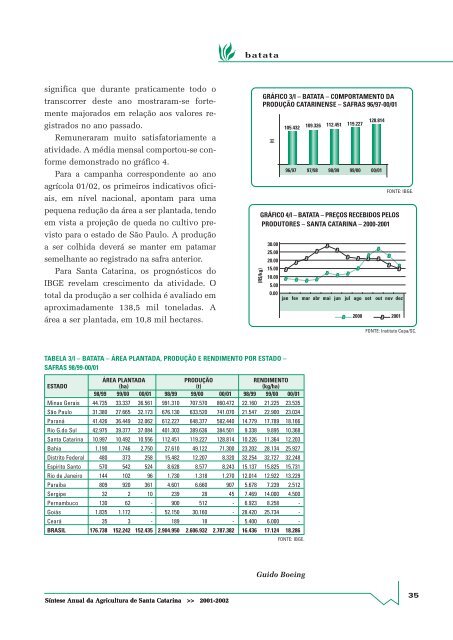
Remuneraram muito satisfatoriamente a<br />
ativi<strong>da</strong><strong>de</strong>. A média mensal comportou-se conforme<br />
<strong>de</strong>monstrado no gráfico 4.<br />
Para a campanha correspon<strong>de</strong>nte ao ano<br />
agrícola 01/02, os primeiros indicativos oficiais,<br />
em nível nacional, apontam para uma<br />
pequena redução <strong>da</strong> área a ser planta<strong>da</strong>, tendo<br />
em vista a projeção <strong>de</strong> que<strong>da</strong> no cultivo previsto<br />
para o estado <strong>de</strong> São Paulo. A produção<br />
a ser colhi<strong>da</strong> <strong>de</strong>verá se manter em patamar<br />
semelhante ao registrado na safra anterior.<br />
Para <strong>Santa</strong> <strong>Catarina</strong>, os prognósticos do<br />
IBGE revelam crescimento <strong>da</strong> ativi<strong>da</strong><strong>de</strong>. O<br />
total <strong>da</strong> produção a ser colhi<strong>da</strong> é avaliado em<br />
aproxima<strong>da</strong>mente 138,5 mil tonela<strong>da</strong>s. A<br />
área a ser planta<strong>da</strong>, em 10,8 mil hectares.<br />
(R$/kg)<br />
GRÁFICO 3/I – BATATA – COMPORTAMENTO DA<br />
PRODUÇÃO CATARINENSE – SAFRAS 96/97-00/01<br />
(t)<br />
105.432 109.326 112.451 119.227<br />
128.814<br />
96/97 97/98 98/99 99/00 00/01<br />
GRÁFICO 4/I – BATATA – PREÇOS RECEBIDOS PELOS<br />
PRODUTORES – SANTA CATARINA – 2000-<strong>2001</strong><br />
FONTE: IBGE.<br />
30.00<br />
25.00<br />
20.00<br />
15.00<br />
10.00<br />
5.00<br />
0.00<br />
jan fev mar abr mai jun jul ago set out nov <strong>de</strong>z<br />
2000 <strong>2001</strong><br />
FONTE: Instituto <strong>Cepa</strong>/SC.<br />
TABELA 3/I – BATATA – ÁREA PLANTADA, PRODUÇÃO E RENDIMENTO POR ESTADO –<br />
SAFRAS 98/99-00/01<br />
ÁREA PLANTADA PRODUÇÃO RENDIMENTO<br />
ESTADO (ha) (t) (kg/ha)<br />
98/99 99/00 00/01 98/99 99/00 00/01 98/99 99/00 00/01<br />
Minas Gerais 44.735 33.337 36.561 991.310 707.570 860.472 22.160 21.225 23.535<br />
São Paulo 31.380 27.665 32.173 676.130 633.520 741.070 21.547 22.900 23.034<br />
Paraná 41.426 36.449 32.062 612.227 648.377 582.440 14.779 17.789 18.166<br />
Rio G.do Sul 42.975 39.377 37.084 401.303 389.636 384.501 9.338 9.895 10.368<br />
<strong>Santa</strong> <strong>Catarina</strong> 10.997 10.492 10.556 112.451 119.227 128.814 10.226 11.364 12.203<br />
Bahia 1.190 1.746 2.750 27.610 49.122 71.300 23.202 28.134 25.927<br />
Distrito Fe<strong>de</strong>ral 480 373 258 15.482 12.207 8.320 32.254 32.727 32.248<br />
Espírito Santo 570 542 524 8.628 8.577 8.243 15.137 15.825 15.731<br />
Rio <strong>de</strong> Janeiro 144 102 96 1.730 1.318 1.270 12.014 12.922 13.229<br />
Paraíba 809 920 361 4.601 6.660 907 5.678 7.239 2.512<br />
Sergipe 32 2 10 239 28 45 7.469 14.000 4.500<br />
Pernambuco 130 62 - 900 512 - 6.923 8.258 -<br />
Goiás 1.835 1.172 - 52.150 30.160 - 28.420 25.734 -<br />
Ceará 35 3 - 189 18 - 5.400 6.000 -<br />
BRASIL 176.738 152.242 152.435 2.904.950 2.606.932 2.787.382 16.436 17.124 18.286<br />
FONTE: IBGE.<br />
Guido Boeing<br />
Síntese <strong>Anual</strong> <strong>da</strong> <strong>Agricultura</strong> <strong>de</strong> <strong>Santa</strong> <strong>Catarina</strong> >> <strong>2001</strong>-<strong>2002</strong><br />
35


