

SÃntese Anual da Agricultura de Santa Catarina - 2001-2002 - Cepa
SÃntese Anual da Agricultura de Santa Catarina - 2001-2002 - Cepa
SÃntese Anual da Agricultura de Santa Catarina - 2001-2002 - Cepa

Create successful ePaper yourself
Turn your PDF publications into a flip-book with our unique Google optimized e-Paper software.
feijão<br />
dutivi<strong>da</strong><strong>de</strong> cresceu quase 20%.<br />
Entre os dois últimos anos agrícolas, os<br />
excessos climáticos trouxeram redução <strong>da</strong><br />
área colhi<strong>da</strong> e <strong>de</strong> produtivi<strong>da</strong><strong>de</strong> – a primeira<br />
cresceu apenas 6% e a segun<strong>da</strong> <strong>de</strong>clinou 3,5%.<br />
Em <strong>de</strong>corrência, a quanti<strong>da</strong><strong>de</strong> produzi<strong>da</strong> elevou-se<br />
pouco menos <strong>de</strong> 3%.<br />
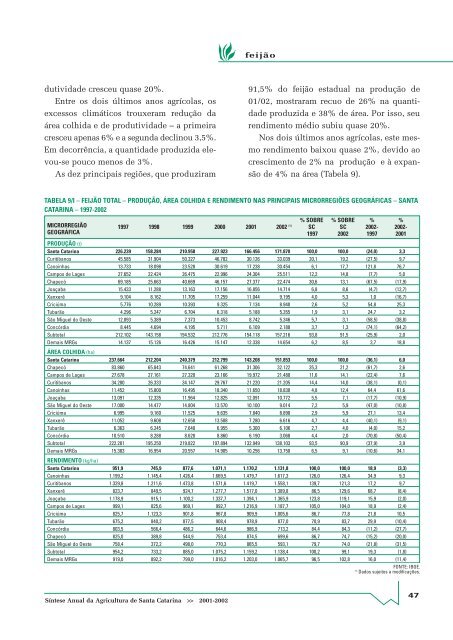
As <strong>de</strong>z principais regiões, que produziram<br />
91,5% do feijão estadual na produção <strong>de</strong><br />
01/02, mostraram recuo <strong>de</strong> 26% na quanti<strong>da</strong><strong>de</strong><br />
produzi<strong>da</strong> e 38% <strong>de</strong> área. Por isso, seu<br />
rendimento médio subiu quase 20%.<br />
Nos dois últimos anos agrícolas, este mesmo<br />
rendimento baixou quase 2%, <strong>de</strong>vido ao<br />
crescimento <strong>de</strong> 2% na produção e à expansão<br />
<strong>de</strong> 4% na área (Tabela 9).<br />
TABELA 9/I – FEIJÃO TOTAL – PRODUÇÃO, ÁREA COLHIDA E RENDIMENTO NAS PRINCIPAIS MICRORREGIÕES GEOGRÁFICAS – SANTA<br />
CATARINA – 1997-<strong>2002</strong><br />
% SOBRE % SOBRE % %<br />
MICRORREGIÃO 1997 1998 1999 2000 <strong>2001</strong> <strong>2002</strong> (1) SC SC <strong>2002</strong>- <strong>2002</strong>-<br />
GEOGRÁFICA 1997 <strong>2002</strong> 1997 <strong>2001</strong><br />
PRODUÇÃO (t)<br />
<strong>Santa</strong> <strong>Catarina</strong> 226.239 158.284 210.958 227.923 166.456 171.870 100,0 100,0 (24,0) 3,3<br />
Curitibanos 45.585 31.904 50.327 46.782 30.126 33.039 20,1 19,2 (27,5) 9,7<br />
Canoinhas 13.733 18.098 23.528 30.619 17.238 30.454 6,1 17,7 121,8 76,7<br />
Campos <strong>de</strong> Lages 27.652 22.424 26.475 22.996 24.304 25.511 12,2 14,8 (7,7) 5,0<br />
Chapecó 69.185 25.663 40.669 46.157 27.377 22.474 30,6 13,1 (67,5) (17,9)<br />
Joaçaba 15.433 11.288 13.163 17.156 16.856 14.714 6,8 8,6 (4,7) (12,7)<br />
Xanxerê 9.104 8.162 11.705 17.259 11.044 9.195 4,0 5,3 1,0 (16,7)<br />
Criciúma 5.776 10.289 10.393 9.325 7.134 8.940 2,6 5,2 54,8 25,3<br />
Tubarão 4.296 5.247 6.704 6.318 5.188 5.355 1,9 3,1 24,7 3,2<br />
São Miguel do Oeste 12.893 5.389 7.373 10.453 8.742 5.346 5,7 3,1 (58,5) (38,8)<br />
Concórdia 8.445 4.694 4.195 5.711 6.109 2.188 3,7 1,3 (74,1) (64,2)<br />
Subtotal 212.102 143.158 194.532 212.776 154.118 157.216 93,8 91,5 (25,9) 2,0<br />
Demais MRGs 14.137 15.126 16.426 15.147 12.338 14.654 6,2 8,5 3,7 18,8<br />
ÁREA COLHIDA (ha)<br />
<strong>Santa</strong> <strong>Catarina</strong> 237.664 212.204 240.379 212.799 143.208 151.853 100,0 100,0 (36,1) 6,0<br />
Chapecó 83.860 65.843 74.641 61.268 31.306 32.122 35,3 21,2 (61,7) 2,6<br />
Campos <strong>de</strong> Lages 27.678 27.161 27.320 23.166 19.972 21.480 11,6 14,1 (22,4) 7,6<br />
Curitibanos 34.280 26.333 34.147 29.767 21.220 21.205 14,4 14,0 (38,1) (0,1)<br />
Canoinhas 11.452 15.800 16.495 18.340 11.650 18.830 4,8 12,4 64,4 61,6<br />
Joaçaba 13.091 12.335 11.964 12.825 12.091 10.772 5,5 7,1 (17,7) (10,9)<br />
São Miguel do Oeste 17.000 14.477 14.804 13.570 10.100 9.014 7,2 5,9 (47,0) (10,8)<br />
Criciúma 6.995 9.160 11.525 9.635 7.840 8.890 2,9 5,9 27,1 13,4<br />
Xanxerê 11.052 9.608 12.658 13.508 7.280 6.616 4,7 4,4 (40,1) (9,1)<br />
Tubarão 6.363 6.245 7.640 6.955 5.300 6.106 2,7 4,0 (4,0) 15,2<br />
Concórdia 10.510 8.288 8.628 8.860 6.190 3.068 4,4 2,0 (70,8) (50,4)<br />
Subtotal 222.281 195.250 219.822 197.894 132.949 138.103 93,5 90,9 (37,9) 3,9<br />
Demais MRGs 15.383 16.954 20.557 14.905 10.256 13.750 6,5 9,1 (10,6) 34,1<br />
RENDIMENTO (kg/ha)<br />
<strong>Santa</strong> <strong>Catarina</strong> 951,9 745,9 877,6 1.071,1 1.170,2 1.131,8 100,0 100,0 18,9 (3,3)<br />
Canoinhas 1.199,2 1.145,4 1.426,4 1.669,5 1.479,7 1.617,3 126,0 126,4 34,9 9,3<br />
Curitibanos 1.329,8 1.211,6 1.473,8 1.571,6 1.419,7 1.558,1 139,7 121,3 17,2 9,7<br />
Xanxerê 823,7 849,5 924,7 1.277,7 1.517,0 1.389,8 86,5 129,6 68,7 (8,4)<br />
Joaçaba 1.178,9 915,1 1.100,2 1.337,7 1.394,1 1.365,9 123,8 119,1 15,9 (2,0)<br />
Campos <strong>de</strong> Lages 999,1 825,6 969,1 992,7 1.216,9 1.187,7 105,0 104,0 18,9 (2,4)<br />
Criciúma 825,7 1.123,3 901,8 967,8 909,9 1.005,6 86,7 77,8 21,8 10,5<br />
Tubarão 675,2 840,2 877,5 908,4 978,9 877,0 70,9 83,7 29,9 (10,4)<br />
Concórdia 803,5 566,4 486,2 644,6 986,9 713,2 84,4 84,3 (11,2) (27,7)<br />
Chapecó 825,0 389,8 544,9 753,4 874,5 699,6 86,7 74,7 (15,2) (20,0)<br />
São Miguel do Oeste 758,4 372,2 498,0 770,3 865,5 593,1 79,7 74,0 (21,8) (31,5)<br />
Subtotal 954,2 733,2 885,0 1.075,2 1.159,2 1.138,4 100,2 99,1 19,3 (1,8)<br />
Demais MRGs 919,0 892,2 799,0 1.016,2 1.203,0 1.065,7 96,5 102,8 16,0 (11,4)<br />
FONTE: IBGE.<br />
(1)<br />
Dados sujeitos a modificações.<br />
Síntese <strong>Anual</strong> <strong>da</strong> <strong>Agricultura</strong> <strong>de</strong> <strong>Santa</strong> <strong>Catarina</strong> >> <strong>2001</strong>-<strong>2002</strong><br />
47


