

SÃntese Anual da Agricultura de Santa Catarina - 2001-2002 - Cepa
SÃntese Anual da Agricultura de Santa Catarina - 2001-2002 - Cepa
SÃntese Anual da Agricultura de Santa Catarina - 2001-2002 - Cepa

You also want an ePaper? Increase the reach of your titles
YUMPU automatically turns print PDFs into web optimized ePapers that Google loves.
<strong>Santa</strong> <strong>Catarina</strong> continua sendo o segundo estado<br />
<strong>da</strong> Fe<strong>de</strong>ração em volume <strong>de</strong> produção <strong>da</strong><br />
hortaliça, superado apenas pelo Rio Gran<strong>de</strong> do<br />
Sul, e já acompanhado muito <strong>de</strong> perto pelo estado<br />
<strong>de</strong> Minas Gerais. Em termos <strong>de</strong> produtivi<strong>da</strong><strong>de</strong><br />
média, a alhicultura catarinense, que se<br />
notabilizou pelas maiores médias até então, foi<br />
suplanta<strong>da</strong> pelos estados do centro do País, que<br />
apresentaram gran<strong>de</strong> evolução nos últimos anos.<br />
A produção estadual na safra <strong>2001</strong> foi 6,7%<br />
maior, a área planta<strong>da</strong> registrou que<strong>da</strong> <strong>de</strong> 0,6%<br />
e o rendimento médio <strong>da</strong>s lavouras passou <strong>de</strong><br />
6.014 para 7.011kg/ha. A maior participação na<br />
oferta estadual, entre as microrregiões, continua<br />
sendo a <strong>de</strong> Curitibanos, que concentrou<br />
85% <strong>da</strong> produção, <strong>de</strong>teve 77,7% <strong>da</strong> área planalho<br />
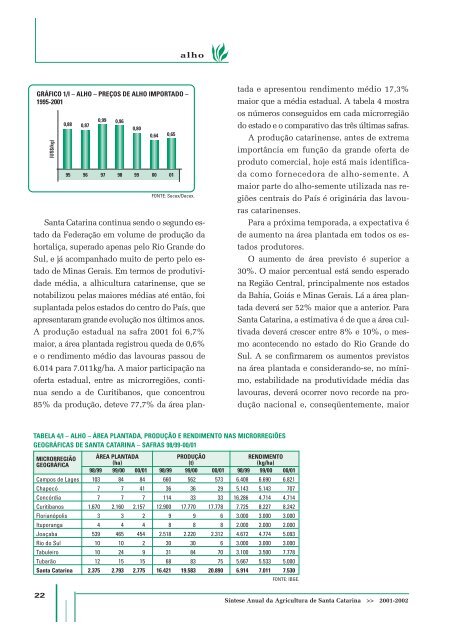
GRÁFICO 1/I – ALHO – PREÇOS DE ALHO IMPORTADO –<br />
1995-<strong>2001</strong><br />
(US$/kg)<br />
0,88 0,87<br />
0,99<br />
0,96<br />
0,80<br />
0,64<br />
0,65<br />
95 96 97 98 99 00 01<br />
FONTE: Secex/Decex.<br />
ta<strong>da</strong> e apresentou rendimento médio 17,3%<br />
maior que a média estadual. A tabela 4 mostra<br />
os números conseguidos em ca<strong>da</strong> microrregião<br />
do estado e o comparativo <strong>da</strong>s três últimas safras.<br />
A produção catarinense, antes <strong>de</strong> extrema<br />
importância em função <strong>da</strong> gran<strong>de</strong> oferta <strong>de</strong><br />
produto comercial, hoje está mais i<strong>de</strong>ntifica<strong>da</strong><br />
como fornecedora <strong>de</strong> alho-semente. A<br />
maior parte do alho-semente utiliza<strong>da</strong> nas regiões<br />
centrais do País é originária <strong>da</strong>s lavouras<br />
catarinenses.<br />
Para a próxima tempora<strong>da</strong>, a expectativa é<br />
<strong>de</strong> aumento na área planta<strong>da</strong> em todos os estados<br />
produtores.<br />
O aumento <strong>de</strong> área previsto é superior a<br />
30%. O maior percentual está sendo esperado<br />
na Região Central, principalmente nos estados<br />
<strong>da</strong> Bahia, Goiás e Minas Gerais. Lá a área planta<strong>da</strong><br />
<strong>de</strong>verá ser 52% maior que a anterior. Para<br />
<strong>Santa</strong> <strong>Catarina</strong>, a estimativa é <strong>de</strong> que a área cultiva<strong>da</strong><br />
<strong>de</strong>verá crescer entre 8% e 10%, o mesmo<br />
acontecendo no estado do Rio Gran<strong>de</strong> do<br />
Sul. A se confirmarem os aumentos previstos<br />
na área planta<strong>da</strong> e consi<strong>de</strong>rando-se, no mínimo,<br />
estabili<strong>da</strong><strong>de</strong> na produtivi<strong>da</strong><strong>de</strong> média <strong>da</strong>s<br />
lavouras, <strong>de</strong>verá ocorrer novo recor<strong>de</strong> na produção<br />
nacional e, conseqüentemente, maior<br />
TABELA 4/I – ALHO – ÁREA PLANTADA, PRODUÇÃO E RENDIMENTO NAS MICRORREGIÕES<br />
GEOGRÁFICAS DE SANTA CATARINA – SAFRAS 98/99-00/01<br />
MICRORREGIÃO ÁREA PLANTADA PRODUÇÃO RENDIMENTO<br />
GEOGRÁFICA (ha) (t) (kg/ha)<br />
98/99 99/00 00/01 98/99 99/00 00/01 98/99 99/00 00/01<br />
Campos <strong>de</strong> Lages 103 84 84 660 562 573 6.408 6.690 6.821<br />
Chapecó 7 7 41 36 36 29 5.143 5.143 707<br />
Concórdia 7 7 7 114 33 33 16.286 4.714 4.714<br />
Curitibanos 1.670 2.160 2.157 12.900 17.770 17.778 7.725 8.227 8.242<br />
Florianópolis 3 3 2 9 9 6 3.000 3.000 3.000<br />
Ituporanga 4 4 4 8 8 8 2.000 2.000 2.000<br />
Joaçaba 539 465 454 2.518 2.220 2.312 4.672 4.774 5.093<br />
Rio do Sul 10 10 2 30 30 6 3.000 3.000 3.000<br />
Tabuleiro 10 24 9 31 84 70 3.100 3.500 7.778<br />
Tubarão 12 15 15 68 83 75 5.667 5.533 5.000<br />
<strong>Santa</strong> <strong>Catarina</strong> 2.375 2.793 2.775 16.421 19.583 20.890 6.914 7.011 7.530<br />
FONTE: IBGE.<br />
22<br />
Síntese <strong>Anual</strong> <strong>da</strong> <strong>Agricultura</strong> <strong>de</strong> <strong>Santa</strong> <strong>Catarina</strong> >> <strong>2001</strong>-<strong>2002</strong>


