milho TABELA 6/I – MILHO – ÁREA PLANTADA, PRODUÇÃO E RENDIMENTO POR ESTADO – BRASIL – SAFRAS – 99/00-01/02 ESTADO ÁREA PLANTADA (1000 ha) PRODUÇÃO (1000 t) RENDIMENTO (kg/ha) 99/00 00/01 01/02 99/00 00/01 01/02 99/00 00/01 01/02 Rondônia 128,2 125,0 106,3 2224,4 193,8 175,4 1.750 1.550 1.650 Acre 34,9 30,0 30, 0 52,4 45,6 45,6 1.500 1.520 1.520 Amazonas 11,8 10,5 10,5 17,3 15,8 15,8 1.466 1.500 1.500 Roraima 15,0 11,0 11,0 19,5 16,5 16,5 1.300 1.500 1.500 Pará 410,0 318,8 341,1 621,2 483,0 573,0 1.515 1.515 1.680 Amapá 1,2 1,2 1,2 1,0 1,0 1,0 800 800 800 Tocantins 57,5 61,5 64,0 115,0 120,5 125,4 2.000 1.960 1.960 Maranhão 320,0 322, 0 321,3 313,6 310,0 289,2 980 960 900 Piauí 283,0 278,0 300,2 231,2 144,6 255,2 817 520 850 Ceará 619,0 612,8 690,6 636,3 245,1 621,5 1.028 400 900 Rio Gran<strong>de</strong> Norte 97,2 83,0 103,8 58,9 8,0 65,4 606 96 630 Paraíba 161,0 140,1 166,7 149,7 8,4 75,0 930 60 450 Pernambuco 300,0 270,0 300,0 139,8 43,2 135,0 466 160 450 Alagoas 66,0 77,9 81,8 22,4 155,8 163,6 340 2.000 2.000 Sergipe 87,0 90,0 99,0 95,7 99,0 108,9 1.100 1.100 1.100 Bahia 654,2 705,5 673,3 1.306,2 1.013,1 993,8 1.997 1.436 1.476 Minas Gerais 1.272,4 1.246,4 1.191,7 4.138,7 4.020,1 4.635,9 3.253 3.225 3.890 Espírito Santo 46,4 46,9 50,2 111,1 129,0 138,1 2.395 2.750 2.750 Rio <strong>de</strong> Janeiro 16,4 14,4 11,8 32,3 28,1 26,9 1.970 1.950 2.280 São Paulo 1.159,3 1.246,4 1.171,4 2.909.1 4.110,3 4.105,9 2.509 3.298 3.505 Paraná 2.668,3 2.796,9 2.492,5 7.037,7 12.282,3 9.583,5 2.638 4.391 3.844 <strong>Santa</strong> <strong>Catarina</strong> 824,6 893,0 839,4 3.257,2 3.947,1 3.147,8 3.950 4.420 3.750 Rio Gran<strong>de</strong> do Sul 1.540,0 1.663,2 1.413,7 3.766,8 6.070,7 3.930,1 2.446 3.650 2.780 Mato Grosso do Sul 513,8 545,9 481,2 1.193,6 2.054,3 1.270,8 2.323 3.763 4.269 Mato Grosso 557,5 542,9 718,3 1.467,2 1.827,9 2.159,6 2.632 3.367 3.007 Goiás 871,8 906,1 728,8 3.571,8 4.026,5 3.217,1 4.097 4.444 4.414 Distrito Fe<strong>de</strong>ral 32,5 33,7 31,4 150,4 130,0 132.2 4.628 3.858 4.210 BRASIL 12.749,0 12.971,9 12.430,9 31.640,5 41.535,2 36.015,7 2.482 3.202 2.897 FONTE: Conab (maio/02). TABELA 7/I – MILHO – ÁREA PLANTADA, PRODUÇÃO E RENDIMENTO POR MICRORREGIÃO GEOGRÁFICA – SANTA CATARINA – SAFRAS – 99/00-01/02 MICRORREGIÃO ÁREA PLANTADA (ha) PRODUÇÃO (t) RENDIMENTO (kg/ha) GEOGRÁFICA 99/00 00/01 01/02 (1) 99/00 00/01 01/02 (1) 99/00 00/01 01/02 (1) São M. do Oeste 119.100 126.700 124.140 439.331 500.688 305.200 3.688 3.952 2.457 Chapecó 193.690 217.120 201.430 773.611 904.805 690.000 3.994 4.167 3.426 Xanxerê 82.850 96.100 79.650 403.298 512.810 383.000 4.867 5.336 4.809 Joaçaba 82.430 86.130 85.930 358.415 395.506 274.980 4.348 4.592 3.200 Concórdia 79.060 78.810 78.330 285.871 323.116 242.820 3.615 4.100 3.100 Canoinhas 70.700 80.900 72.900 384.300 458.796 455.340 5.435 5.671 6.246 São Bento do Sul 7.800 7.840 7.940 34.020 36.588 45.676 4.361 4.667 5.753 Joinville 1.638 1.581 1.484 6.279 5.577 5.283 3.833 3.528 3.560 Curitibanos 49.170 56.980 50.300 235.081 292.449 259.982 4.780 5.132 5.169 Campos <strong>de</strong> Lages 44.440 46.740 45.290 131.570 143.295 132.892 2.960 3.066 2.934 Rio do Sul 29.105 29.090 27.085 110.601 120.174 111.939 3.800 4.131 4.133 Blumenau 6.707 6.770 5.373 18.877 19.642 15.912 2.815 2.901 2.961 Itajaí 470 348 60 1.253 888 149 2.665 2.552 2.483 Ituporanga 17.750 18.700 17.200 80.850 84.564 76.280 4.554 4.522 4.435 Tijucas 4.520 4.910 3.690 15.141 16.606 13.592 3.350 3.382 3.683 Florianópolis 1.385 1.437 1.535 4.599 4.798 5.139 3.320 3333 3.348 Tabuleiro 5.600 5.600 5.580 18.010 19.620 22.984 3.216 3.504 4.119 Tubarão 11.595 11.796 11.630 41.452 43.895 44.970 3.575 3.721 3.867 Criciúma 8.300 9.280 8.382 32.076 35.793 36.900 3864 3.857 4.402 Araranguá 9.700 9.280 6.480 28.630 27.269 18.796 2.952 2.983 2.900 SANTA CATARINA 826.010 896.112 834.409 3.403.265 3.946.870 3.141.789 4.120 4.404 3.765 FONTE: IBGE. (1) Estimativa do Instituto <strong>Cepa</strong>/SC. Simão Brugnago Neto 72 Síntese <strong>Anual</strong> <strong>da</strong> <strong>Agricultura</strong> <strong>de</strong> <strong>Santa</strong> <strong>Catarina</strong> >> <strong>2001</strong>-<strong>2002</strong>
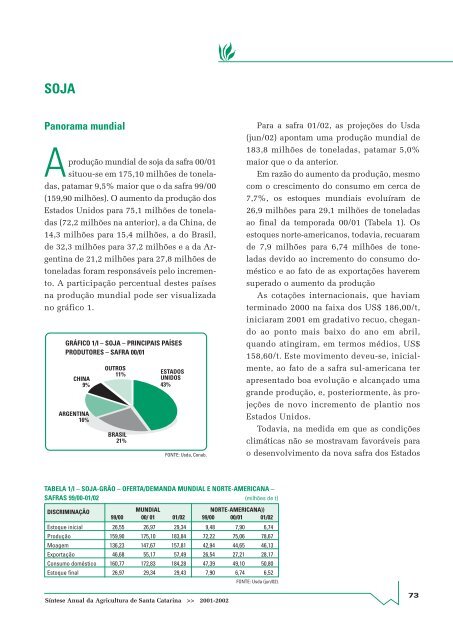
SOJA Panorama mundial Aprodução mundial <strong>de</strong> soja <strong>da</strong> safra 00/01 situou-se em 175,10 milhões <strong>de</strong> tonela<strong>da</strong>s, patamar 9,5% maior que o <strong>da</strong> safra 99/00 (159,90 milhões). O aumento <strong>da</strong> produção dos Estados Unidos para 75,1 milhões <strong>de</strong> tonela<strong>da</strong>s (72,2 milhões na anterior), a <strong>da</strong> China, <strong>de</strong> 14,3 milhões para 15,4 milhões, a do Brasil, <strong>de</strong> 32,3 milhões para 37,2 milhões e a <strong>da</strong> Argentina <strong>de</strong> 21,2 milhões para 27,8 milhões <strong>de</strong> tonela<strong>da</strong>s foram responsáveis pelo incremento. A participação percentual <strong>de</strong>stes países na produção mundial po<strong>de</strong> ser visualiza<strong>da</strong> no gráfico 1. GRÁFICO 1/I – SOJA – PRINCIPAIS PAÍSES PRODUTORES – SAFRA 00/01 CHINA 9% ARGENTINA 16% OUTROS 11% BRASIL 21% ESTADOS UNIDOS 43% FONTE: Us<strong>da</strong>, Conab. Para a safra 01/02, as projeções do Us<strong>da</strong> (jun/02) apontam uma produção mundial <strong>de</strong> 183,8 milhões <strong>de</strong> tonela<strong>da</strong>s, patamar 5,0% maior que o <strong>da</strong> anterior. Em razão do aumento <strong>da</strong> produção, mesmo com o crescimento do consumo em cerca <strong>de</strong> 7,7%, os estoques mundiais evoluíram <strong>de</strong> 26,9 milhões para 29,1 milhões <strong>de</strong> tonela<strong>da</strong>s ao final <strong>da</strong> tempora<strong>da</strong> 00/01 (Tabela 1). Os estoques norte-americanos, to<strong>da</strong>via, recuaram <strong>de</strong> 7,9 milhões para 6,74 milhões <strong>de</strong> tonela<strong>da</strong>s <strong>de</strong>vido ao incremento do consumo doméstico e ao fato <strong>de</strong> as exportações haverem superado o aumento <strong>da</strong> produção As cotações internacionais, que haviam terminado 2000 na faixa dos US$ 186,00/t, iniciaram <strong>2001</strong> em gra<strong>da</strong>tivo recuo, chegando ao ponto mais baixo do ano em abril, quando atingiram, em termos médios, US$ 158,60/t. Este movimento <strong>de</strong>veu-se, inicialmente, ao fato <strong>de</strong> a safra sul-americana ter apresentado boa evolução e alcançado uma gran<strong>de</strong> produção, e, posteriormente, às projeções <strong>de</strong> novo incremento <strong>de</strong> plantio nos Estados Unidos. To<strong>da</strong>via, na medi<strong>da</strong> em que as condições climáticas não se mostravam favoráveis para o <strong>de</strong>senvolvimento <strong>da</strong> nova safra dos Estados TABELA 1/I – SOJA-GRÃO – OFERTA/DEMANDA MUNDIAL E NORTE-AMERICANA – SAFRAS 99/00-01/02 (milhões <strong>de</strong> t) DISCRIMINAÇÃO MUNDIAL NORTE-AMERICANA)) 99/00 00/ 01 01/02 99/00 00/01 01/02 Estoque inicial 26,55 26,97 29,34 9,48 7,90 6,74 Produção 159,90 175,10 183,84 72,22 75,06 78,67 Moagem 136,23 147,67 157,81 42,94 44,65 46,13 Exportação 46,68 55,17 57,49 26,54 27,21 28,17 Consumo doméstico 160,77 172,83 184,28 47,39 49,10 50,80 Estoque final 26,97 29,34 29,43 7,90 6,74 6,52 FONTE: Us<strong>da</strong> (jun/02). Síntese <strong>Anual</strong> <strong>da</strong> <strong>Agricultura</strong> <strong>de</strong> <strong>Santa</strong> <strong>Catarina</strong> >> <strong>2001</strong>-<strong>2002</strong> 73
- Page 2 and 3:
INSTITUTO DE PLANEJAMENTO E ECONOMI
- Page 4 and 5:
apresentação Oestado de Santa Cat
- Page 6 and 7:
sumário DESEMPENHO DA PESCA ......
- Page 8 and 9:
Parte 1 A CONJUNTURA ECONÔMICA EM
- Page 10 and 11:
do. As responsabilidades pelos risc
- Page 12 and 13:
A pecuária participa com pouco mai
- Page 14 and 15:
crescentes, não foram suficientes
- Page 16 and 17:
AS REGRAS PARA A SAFRA 02/03 Em 24
- Page 18 and 19:
as regras para a safra 02/03 mento
- Page 20 and 21:
Desempenho da produção vegetal AL
- Page 22 and 23: Santa Catarina continua sendo o seg
- Page 24 and 25: arroz Em termos de rendimento, por
- Page 26 and 27: arroz TABELA 4/I - ARROZ EM CASCA -
- Page 28 and 29: BANANA Dentre as frutas cultivadas
- Page 30 and 31: anana TABELA 2/I - BANANA - ÁREA P
- Page 32 and 33: anana forma, retardou a recuperaç
- Page 34 and 35: atata TABELA 1/I - BATATA - ÁREA P
- Page 36 and 37: CEBOLA Os dados de desempenho da ce
- Page 38 and 39: cebola GRÁFICO 3/I - CEBOLA - COMP
- Page 40 and 41: FEIJÃO Produção mundial estabili
- Page 42 and 43: feijão TABELA 3/I - FEIJÃO - PROD
- Page 44 and 45: feijão expectativa de níveis elev
- Page 46 and 47: feijão clínio de produtividade (-
- Page 48 and 49: feijão Estes números expressam:
- Page 50 and 51: feijão TABELA 11/I - FEIJÃO 2ª S
- Page 52 and 53: fumo Safra 01/02 - Situação do Su
- Page 54 and 55: fumo parte do seu custo de produç
- Page 56 and 57: MAÇÃ Aprodução brasileira de ma
- Page 58 and 59: potencial produtivo dos pomares já
- Page 60 and 61: mandioca Os países que mais import
- Page 62 and 63: mandioca se negativamente nos valor
- Page 64 and 65: No Litoral Sul Catarinense, os pre
- Page 66 and 67: mandioca / milho Perspectivas As pe
- Page 68 and 69: milho Entretanto, a perspectiva de
- Page 70 and 71: milho A perspectiva inicial de um s
- Page 74 and 75: soja Unidos, o mercado voltou a sub
- Page 76 and 77: soja (R$/sc) GRÁFICO 5/I - SOJA -
- Page 78 and 79: TOMATE Otomate é uma das mais impo
- Page 80 and 81: tomate portante no contexto naciona
- Page 82 and 83: quando a área plantada foi 5,5% ma
- Page 84 and 85: trigo TABELA 7/I - TRIGO - OFERTA E
- Page 86 and 87: trigo TABELA 13/I - TRIGO - PREÇOS
- Page 88 and 89: uva GRÁFICO 1/I - UVA - PARTICIPA
- Page 90 and 91: FLORES E PLANTAS ORNAMENTAIS Situa
- Page 92 and 93: 30,9%; floricultura-terceiros - 20,
- Page 94 and 95: flores e plantas ornamentais lizado
- Page 96 and 97: calendário agrícola QUADRO 1/I -
- Page 98 and 99: carne de frango Panorama catarinens
- Page 100 and 101: carne bovina GRÁFICO 2/I - CARNE B
- Page 102 and 103: carne suína A produção catarinen
- Page 104 and 105: carne suína / leite TABELA 3/I - A
- Page 106 and 107: leite Dentre os outros países com
- Page 108 and 109: leite TABELA 4/I - LEITE - PRODUÇ
- Page 110 and 111: leite TABELA 10/I - LEITE E DERIVAD
- Page 112 and 113: leite TABELA 14/I - LEITE - PREÇOS
- Page 114 and 115: mel TABELA 1/I - MEL - QUANTIDADE T
- Page 116 and 117: mel TABELA 5/I - MEL - VALOR DAS IM
- Page 118 and 119: mel expressiva, usada mais para fin
- Page 120 and 121: mel QUADRO 1/I - MEL - CALENDÁRIO
- Page 122 and 123:
Desempenho da pesca PESCA No Brasil
- Page 124 and 125:
pesca GRÁFICO 1/I - PESCADO - IMPO
- Page 126 and 127:
pesca Laguna vêm a seguir, com uma
- Page 128 and 129:
Desempenho da aqüicultura AQÜICUL
- Page 130 and 131:
piscicultura e garantindo a compra
- Page 132 and 133:
CAMARÃO MARINHO Acarcinicultura, n
- Page 134 and 135:
camarão marinho As exportações c
- Page 136 and 137:
moluscos GRÁFICO 1/I - PRODUÇÃO
- Page 138 and 139:
DESEMPENHO DO SETOR FLORESTAL Panor
- Page 140 and 141:
setor florestal quase todas as regi
- Page 142 and 143:
O Brasil tem uma posição importan
- Page 144 and 145:
setor florestal ção, do consumo e
- Page 146 and 147:
setor florestal A produção catari
- Page 148 and 149:
setor florestal portado pelos três
- Page 150 and 151:
setor florestal de madeiras, desenv
- Page 152 and 153:
parte 2 Continuação MUNICíPIO Á
- Page 154 and 155:
ARGENTINA Dionísio Cerqueira Guaru
- Page 156 and 157:
parte 2 TABELA 4/II - UMIDADE RELAT
- Page 158 and 159:
parte 2 TABELA 8/II - POPULAÇÃO R
- Page 160 and 161:
parte 2 Conclusão MUNICÍPIO POPUL
- Page 162 and 163:
parte 2 ESTRUTURA DE PRODUÇÃO E C
- Page 164 and 165:
parte 2 TABELA 17/II - MÁQUINAS AG
- Page 166 and 167:
parte 2 TABELA 23/II - EXPORTAÇÕE
- Page 168 and 169:
parte 2 TABELA 25/II - VALOR BRUTO
- Page 170 and 171:
parte 2 (conclusão) ANO MÊS ARROZ
- Page 172 and 173:
parte 2 TABELA 30/II - PREÇOS MÉD
- Page 174 and 175:
parte 2 TABELA 32/II - PREÇOS MÉD
- Page 176 and 177:
parte 2 TABELA 34/II - EQUIVALÊNCI
- Page 178 and 179:
anexo I Catanduvas Erval Velho MESO
- Page 180 and 181:
anexo II São Bonifácio ASSOCIAÇ
- Page 182 and 183:
anexo II / anexo III ASSOCIAÇÃO D
- Page 184 and 185:
anexo III REGIÃO HIDROGRÁFICA BAC
- Page 186 and 187:
anexo III RH-6 BAIXADA NORTE RIO CU
- Page 188 and 189:
anexo III REGIÃO HIDROGRÁFICA BAC
- Page 190 and 191:
anexo IV Produto - Resultado de qua
- Page 192 and 193:
LISTA DE GRÁFICOS ALHO 1. Preços
- Page 194 and 195:
lista de gráficos CARNE BOVINA 1.
- Page 196 and 197:
LISTA DE TABELAS A CONJUNTURA ECON
- Page 198 and 199:
lista de tabelas 7. Exportações c
- Page 200 and 201:
lista de tabelas DESEMPENHO DA PROD
- Page 202 and 203:
lista de tabelas 4. Produção mund
- Page 204:
ÍNDICE REMISSIVO Alho, 20-23 Aqüi