SÃntese Anual da Agricultura de Santa Catarina - 2001-2002 - Cepa
SÃntese Anual da Agricultura de Santa Catarina - 2001-2002 - Cepa
SÃntese Anual da Agricultura de Santa Catarina - 2001-2002 - Cepa
You also want an ePaper? Increase the reach of your titles
YUMPU automatically turns print PDFs into web optimized ePapers that Google loves.
anana<br />
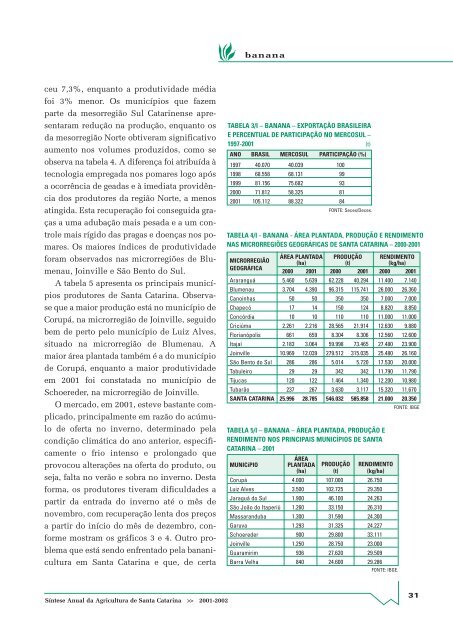
ceu 7,3%, enquanto a produtivi<strong>da</strong><strong>de</strong> média<br />
foi 3% menor. Os municípios que fazem<br />
parte <strong>da</strong> mesorregião Sul Catarinense apresentaram<br />
redução na produção, enquanto os<br />
<strong>da</strong> mesorregião Norte obtiveram significativo<br />
aumento nos volumes produzidos, como se<br />
observa na tabela 4. A diferença foi atribuí<strong>da</strong> à<br />
tecnologia emprega<strong>da</strong> nos pomares logo após<br />
a ocorrência <strong>de</strong> gea<strong>da</strong>s e à imediata providência<br />
dos produtores <strong>da</strong> região Norte, a menos<br />
atingi<strong>da</strong>. Esta recuperação foi consegui<strong>da</strong> graças<br />
a uma adubação mais pesa<strong>da</strong> e a um controle<br />
mais rígido <strong>da</strong>s pragas e doenças nos pomares.<br />
Os maiores índices <strong>de</strong> produtivi<strong>da</strong><strong>de</strong><br />
foram observados nas microrregiões <strong>de</strong> Blumenau,<br />
Joinville e São Bento do Sul.<br />
A tabela 5 apresenta os principais municípios<br />
produtores <strong>de</strong> <strong>Santa</strong> <strong>Catarina</strong>. Observase<br />
que a maior produção está no município <strong>de</strong><br />
Corupá, na microrregião <strong>de</strong> Joinville, seguido<br />
bem <strong>de</strong> perto pelo município <strong>de</strong> Luiz Alves,<br />
situado na microrregião <strong>de</strong> Blumenau. A<br />
maior área planta<strong>da</strong> também é a do município<br />
<strong>de</strong> Corupá, enquanto a maior produtivi<strong>da</strong><strong>de</strong><br />
em <strong>2001</strong> foi constata<strong>da</strong> no município <strong>de</strong><br />
Schoere<strong>de</strong>r, na microrregião <strong>de</strong> Joinville.<br />
O mercado, em <strong>2001</strong>, esteve bastante complicado,<br />
principalmente em razão do acúmulo<br />
<strong>de</strong> oferta no inverno, <strong>de</strong>terminado pela<br />
condição climática do ano anterior, especificamente<br />
o frio intenso e prolongado que<br />
provocou alterações na oferta do produto, ou<br />
seja, falta no verão e sobra no inverno. Desta<br />
forma, os produtores tiveram dificul<strong>da</strong><strong>de</strong>s a<br />
partir <strong>da</strong> entra<strong>da</strong> do inverno até o mês <strong>de</strong><br />
novembro, com recuperação lenta dos preços<br />
a partir do início do mês <strong>de</strong> <strong>de</strong>zembro, conforme<br />
mostram os gráficos 3 e 4. Outro problema<br />
que está sendo enfrentado pela bananicultura<br />
em <strong>Santa</strong> <strong>Catarina</strong> e que, <strong>de</strong> certa<br />
TABELA 3/I – BANANA – EXPORTAÇÃO BRASILEIRA<br />
E PERCENTUAL DE PARTICIPAÇÃO NO MERCOSUL –<br />
1997-<strong>2001</strong> (t)<br />
ANO BRASIL MERCOSUL PARTICIPAÇÃO (%)<br />
1997 40.070 40.039 100<br />
1998 68.558 68.131 99<br />
1999 81.156 75.682 93<br />
2000 71.812 58.325 81<br />
<strong>2001</strong> 105.112 88.322 84<br />
MUNICíPIO<br />
FONTE: Secex/Decex.<br />
TABELA 4/I - BANANA - ÁREA PLANTADA, PRODUÇÃO E RENDIMENTO<br />
NAS MICRORREGIÕES GEOGRÁFICAS DE SANTA CATARINA – 2000-<strong>2001</strong><br />
ÁREA PLANTADA PRODUÇÃO RENDIMENTO<br />
MICRORREGIÃO (ha) (t) (kg/ha)<br />
GEOGRÁFICA<br />
2000 <strong>2001</strong> 2000 <strong>2001</strong> 2000 <strong>2001</strong><br />
Araranguá 5.460 5.639 62.228 40.294 11.400 7.140<br />
Blumenau 3.704 4.390 96.315 115.741 26.000 26.360<br />
Canoinhas 50 50 350 350 7.000 7.000<br />
Chapecó 17 14 150 124 8.820 8.850<br />
Concórdia 10 10 110 110 11.000 11.000<br />
Criciúma 2.261 2.216 28.565 21.914 12.630 9.880<br />
Florianópolis 661 659 8.304 8.306 12.560 12.600<br />
Itajaí 2.183 3.064 59.998 73.465 27.480 23.900<br />
Joinville 10.969 12.039 279.512 315.035 25.480 26.160<br />
São Bento do Sul 286 286 5.014 5.720 17.530 20.000<br />
Tabuleiro 29 29 342 342 11.790 11.790<br />
Tijucas 120 122 1.464 1.340 12.200 10.980<br />
Tubarão 237 267 3.630 3.117 15.320 11.670<br />
SANTA CATARINA 25.996 28.785 546.032 585.858 21.000 20.350<br />
TABELA 5/I – BANANA – ÁREA PLANTADA, PRODUÇÃO E<br />
RENDIMENTO NOS PRINCIPAIS MUNICÍPIOS DE SANTA<br />
CATARINA – <strong>2001</strong><br />
ÁREA<br />
PLANTADA PRODUÇÃO RENDIMENTO<br />
(ha) (t) (kg/ha)<br />
Corupá 4.000 107.000 26.750<br />
Luiz Alves 3.500 102.725 29.350<br />
Jaraguá do Sul 1.900 46.100 24.263<br />
São João do Itaperiú 1.260 33.150 26.310<br />
Massaranduba 1.300 31.590 24.300<br />
Garuva 1.293 31.325 24.227<br />
Schoere<strong>de</strong>r 900 29.800 33.111<br />
Joinville 1.250 28.750 23.000<br />
Guaramirim 936 27.620 29.509<br />
Barra Velha 840 24.600 29.286<br />
FONTE: IBGE.<br />
FONTE: IBGE<br />
Síntese <strong>Anual</strong> <strong>da</strong> <strong>Agricultura</strong> <strong>de</strong> <strong>Santa</strong> <strong>Catarina</strong> >> <strong>2001</strong>-<strong>2002</strong><br />
31


