

SÃntese Anual da Agricultura de Santa Catarina - 2001-2002 - Cepa
SÃntese Anual da Agricultura de Santa Catarina - 2001-2002 - Cepa
SÃntese Anual da Agricultura de Santa Catarina - 2001-2002 - Cepa

You also want an ePaper? Increase the reach of your titles
YUMPU automatically turns print PDFs into web optimized ePapers that Google loves.
FEIJÃO<br />
Produção mundial estabiliza<strong>da</strong> e<br />
produtivi<strong>da</strong><strong>de</strong> em alta<br />
Aprodução mundial dos feijões veio<br />
crescendo progressivamente <strong>de</strong>s<strong>de</strong> princípio<br />
dos anos 60 do século passado. Alcançou<br />
15 milhões <strong>de</strong> tonela<strong>da</strong>s ao iniciar-se a<br />
déca<strong>da</strong> <strong>de</strong> 80 e <strong>de</strong>s<strong>de</strong> o seu final passou a oscilar<br />
em torno <strong>de</strong> 16 milhões <strong>de</strong> tonela<strong>da</strong>s.<br />
Nos últimos cinco anos, a evolução <strong>da</strong> produção<br />
<strong>da</strong> varia<strong>da</strong> gama <strong>de</strong> feijões no mundo<br />
mostrou minúsculo crescimento <strong>de</strong> 2%. Em<br />
relação ao ano 2000, a atual safra mundial foilhe<br />
inferior nos mesmos 2%.<br />
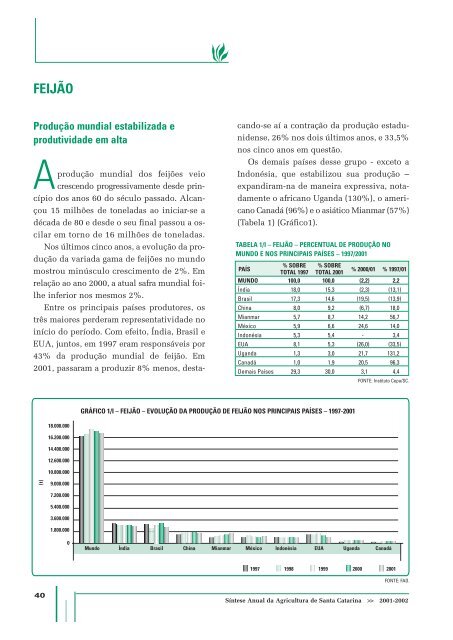
Entre os principais países produtores, os<br />
três maiores per<strong>de</strong>ram representativi<strong>da</strong><strong>de</strong> no<br />
início do período. Com efeito, Índia, Brasil e<br />
EUA, juntos, em 1997 eram responsáveis por<br />
43% <strong>da</strong> produção mundial <strong>de</strong> feijão. Em<br />
<strong>2001</strong>, passaram a produzir 8% menos, <strong>de</strong>stacando-se<br />
aí a contração <strong>da</strong> produção estaduni<strong>de</strong>nse,<br />
26% nos dois últimos anos, e 33,5%<br />
nos cinco anos em questão.<br />
Os <strong>de</strong>mais países <strong>de</strong>sse grupo - exceto a<br />
Indonésia, que estabilizou sua produção –<br />
expandiram-na <strong>de</strong> maneira expressiva, nota<strong>da</strong>mente<br />
o africano Ugan<strong>da</strong> (130%), o americano<br />
Canadá (96%) e o asiático Mianmar (57%)<br />
(Tabela 1) (Gráfico1).<br />
TABELA 1/I – FEIJÃO – PERCENTUAL DE PRODUÇÃO NO<br />
MUNDO E NOS PRINCIPAIS PAÍSES – 1997/<strong>2001</strong><br />
% SOBRE % SOBRE<br />
PAÍS<br />
TOTAL 1997 TOTAL <strong>2001</strong><br />
% 2000/01 % 1997/01<br />
MUNDO 100,0 100,0 (2,2) 2,2<br />
Índia 18,0 15,3 (2,3) (13,1)<br />
Brasil 17,3 14,6 (19,5) (13,9)<br />
China 8,0 9,2 (6,7) 18,0<br />
Mianmar 5,7 8,7 14,2 56,7<br />
México 5,9 6,6 24,6 14,0<br />
Indonésia 5,3 5,4 - 3,4<br />
EUA 8,1 5,3 (26,0) (33,5)<br />
Ugan<strong>da</strong> 1,3 3,0 21,7 131,2<br />
Canadá 1,0 1,9 20,5 96,3<br />
Demais Países 29,3 30,0 3,1 4,4<br />
FONTE: Instituto <strong>Cepa</strong>/SC.<br />
GRÁFICO 1/I – FEIJÃO – EVOLUÇÃO DA PRODUÇÃO DE FEIJÃO NOS PRINCIPAIS PAÍSES – 1997-<strong>2001</strong><br />
18.000.000<br />
16.200.000<br />
14.400.000<br />
12.600.000<br />
10.800.000<br />
(t)<br />
9.000.000<br />
7.200.000<br />
5.400.000<br />
3.600.000<br />
1.800.000<br />
0<br />
Mundo Índia Brasil China Mianmar México Indonésia EUA Ugan<strong>da</strong> Canadá<br />
1997<br />
1998<br />
1999<br />
2000<br />
<strong>2001</strong><br />
FONTE: FAO.<br />
40<br />
Síntese <strong>Anual</strong> <strong>da</strong> <strong>Agricultura</strong> <strong>de</strong> <strong>Santa</strong> <strong>Catarina</strong> >> <strong>2001</strong>-<strong>2002</strong>


