

SÃntese Anual da Agricultura de Santa Catarina - 2001-2002 - Cepa
SÃntese Anual da Agricultura de Santa Catarina - 2001-2002 - Cepa
SÃntese Anual da Agricultura de Santa Catarina - 2001-2002 - Cepa

Create successful ePaper yourself
Turn your PDF publications into a flip-book with our unique Google optimized e-Paper software.
feijão<br />
expectativa <strong>de</strong> níveis elevados <strong>de</strong> produtivi<strong>da</strong><strong>de</strong>,<br />
porém, o excesso <strong>de</strong> chuvas na colheita,<br />
além <strong>de</strong> prejudicar o rendimento <strong>da</strong>s plantas,<br />
afetou bastante a quali<strong>da</strong><strong>de</strong> do produto.<br />
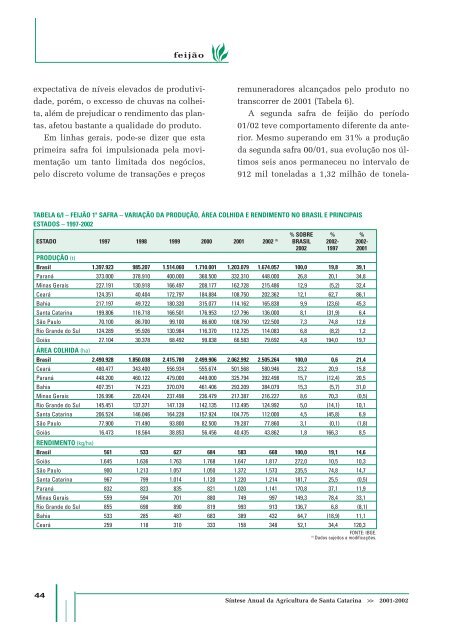
Em linhas gerais, po<strong>de</strong>-se dizer que esta<br />
primeira safra foi impulsiona<strong>da</strong> pela movimentação<br />
um tanto limita<strong>da</strong> dos negócios,<br />
pelo discreto volume <strong>de</strong> transações e preços<br />
remuneradores alcançados pelo produto no<br />
transcorrer <strong>de</strong> <strong>2001</strong> (Tabela 6).<br />
A segun<strong>da</strong> safra <strong>de</strong> feijão do período<br />
01/02 teve comportamento diferente <strong>da</strong> anterior.<br />
Mesmo superando em 31% a produção<br />
<strong>da</strong> segun<strong>da</strong> safra 00/01, sua evolução nos últimos<br />
seis anos permaneceu no intervalo <strong>de</strong><br />
912 mil tonela<strong>da</strong>s a 1,32 milhão <strong>de</strong> tonela-<br />
TABELA 6/I – FEIJÃO 1ª SAFRA – VARIAÇÃO DA PRODUÇÃO, ÁREA COLHIDA E RENDIMENTO NO BRASIL E PRINCIPAIS<br />
ESTADOS – 1997-<strong>2002</strong><br />
% SOBRE % %<br />
ESTADO 1997 1998 1999 2000 <strong>2001</strong> <strong>2002</strong> (1) BRASIL <strong>2002</strong>- <strong>2002</strong>-<br />
<strong>2002</strong> 1997 <strong>2001</strong><br />
PRODUÇÃO (t)<br />
Brasil 1.397.923 985.207 1.514.060 1.710.001 1.203.079 1.674.057 100,0 19,8 39,1<br />
Paraná 373.000 378.910 400.000 368.500 332.310 448.000 26,8 20,1 34,8<br />
Minas Gerais 227.191 130.918 166.497 208.177 162.728 215.486 12,9 (5,2) 32,4<br />
Ceará 124.351 40.404 172.797 184.884 108.750 202.362 12,1 62,7 86,1<br />
Bahia 217.197 49.722 180.320 315.077 114.162 165.838 9,9 (23,6) 45,3<br />
<strong>Santa</strong> <strong>Catarina</strong> 199.806 116.718 166.501 176.953 127.796 136.000 8,1 (31,9) 6,4<br />
São Paulo 70.100 86.700 99.100 86.600 108.750 122.500 7,3 74,8 12,6<br />
Rio Gran<strong>de</strong> do Sul 124.289 95.926 130.984 116.370 112.725 114.083 6,8 (8,2) 1,2<br />
Goiás 27.104 30.378 68.492 99.838 66.583 79.692 4,8 194,0 19,7<br />
ÁREA COLHIDA (ha)<br />
Brasil 2.490.928 1.850.038 2.415.780 2.499.906 2.062.992 2.505.264 100,0 0,6 21,4<br />
Ceará 480.477 343.400 556.934 555.674 501.568 580.946 23,2 20,9 15,8<br />
Paraná 448.200 460.122 479.000 449.000 325.794 392.498 15,7 (12,4) 20,5<br />
Bahia 407.351 74.223 370.070 461.406 293.209 384.079 15,3 (5,7) 31,0<br />
Minas Gerais 126.996 220.424 237.498 236.479 217.387 216.227 8,6 70,3 (0,5)<br />
Rio Gran<strong>de</strong> do Sul 145.451 137.371 147.139 142.135 113.495 124.992 5,0 (14,1) 10,1<br />
<strong>Santa</strong> <strong>Catarina</strong> 206.524 146.046 164.228 157.924 104.775 112.000 4,5 (45,8) 6,9<br />
São Paulo 77.900 71.490 93.800 82.500 79.287 77.860 3,1 (0,1) (1,8)<br />
Goiás 16.473 18.564 38.853 56.456 40.435 43.862 1,8 166,3 8,5<br />
RENDIMENTO (kg/ha)<br />
Brasil 561 533 627 684 583 668 100,0 19,1 14,6<br />
Goiás 1.645 1.636 1.763 1.768 1.647 1.817 272,0 10,5 10,3<br />
São Paulo 900 1.213 1.057 1.050 1.372 1.573 235,5 74,8 14,7<br />
<strong>Santa</strong> <strong>Catarina</strong> 967 799 1.014 1.120 1.220 1.214 181,7 25,5 (0,5)<br />
Paraná 832 823 835 821 1.020 1.141 170,8 37,1 11,9<br />
Minas Gerais 559 594 701 880 749 997 149,3 78,4 33,1<br />
Rio Gran<strong>de</strong> do Sul 855 698 890 819 993 913 136,7 6,8 (8,1)<br />
Bahia 533 285 487 683 389 432 64,7 (18,9) 11,1<br />
Ceará 259 118 310 333 158 348 52,1 34,4 120,3<br />
FONTE: IBGE.<br />
(1)<br />
Dados sujeitos a modificações.<br />
44<br />
Síntese <strong>Anual</strong> <strong>da</strong> <strong>Agricultura</strong> <strong>de</strong> <strong>Santa</strong> <strong>Catarina</strong> >> <strong>2001</strong>-<strong>2002</strong>


