

SÃntese Anual da Agricultura de Santa Catarina - 2001-2002 - Cepa
SÃntese Anual da Agricultura de Santa Catarina - 2001-2002 - Cepa
SÃntese Anual da Agricultura de Santa Catarina - 2001-2002 - Cepa

You also want an ePaper? Increase the reach of your titles
YUMPU automatically turns print PDFs into web optimized ePapers that Google loves.
feijão<br />
<strong>da</strong>s, com tendência a que<strong>da</strong> (-9%). Esta, por<br />
sua vez, <strong>de</strong>veu-se essencialmente à forte que<strong>da</strong><br />
<strong>de</strong> área (31% <strong>de</strong>s<strong>de</strong> 1997), pois a produtivi<strong>da</strong><strong>de</strong><br />
do feijão cresceu 7% entre as duas<br />
últimas safrinhas e 32% <strong>de</strong>s<strong>de</strong> 1997.<br />
O aumento <strong>de</strong> área <strong>da</strong> presente safrinha<br />
(01/02) foi igualmente impulsionado por<br />
comportamento <strong>de</strong> mercado e preços em<br />
tudo semelhantes aos <strong>da</strong> primeira safra.<br />
Limitou-se a 22% por causa <strong>da</strong> insuficiência<br />
<strong>de</strong> água no período <strong>de</strong> plantio<br />
(pouca chuva + baixa umi<strong>da</strong><strong>de</strong> do solo). A<br />
continui<strong>da</strong><strong>de</strong> do fenômeno durante o ciclo<br />
<strong>da</strong> cultura terminou por afetar os índices<br />
<strong>de</strong> produtivi<strong>da</strong><strong>de</strong> e a quali<strong>da</strong><strong>de</strong> dos<br />
grãos (Tabela 7).<br />
A terceira safra cresceu mo<strong>de</strong>stamente no<br />
período <strong>de</strong> seis anos (3,5%), mas <strong>de</strong>clinou significativamente<br />
entre os dois últimos anos agrícolas<br />
(-11,5%). Isto se <strong>de</strong>veu principalmente à<br />
redução <strong>de</strong> área, embora nesta terceira safra fatores<br />
climáticos tenham imposto pequeno <strong>de</strong>-<br />
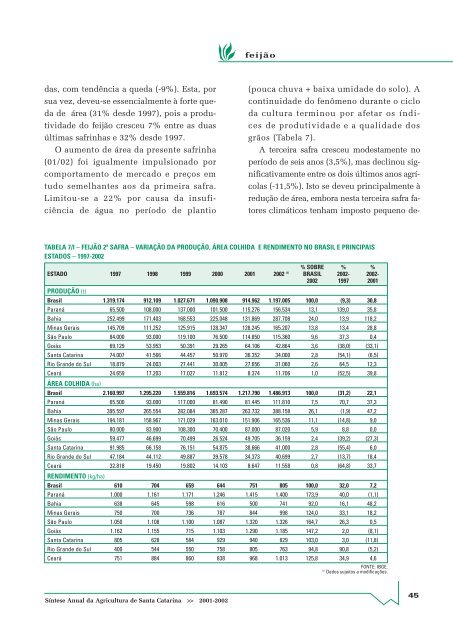
TABELA 7/I – FEIJÃO 2ª SAFRA – VARIAÇÃO DA PRODUÇÃO, ÁREA COLHIDA E RENDIMENTO NO BRASIL E PRINCIPAIS<br />
ESTADOS – 1997-<strong>2002</strong><br />
% SOBRE % %<br />
ESTADO 1997 1998 1999 2000 <strong>2001</strong> <strong>2002</strong> (1) BRASIL <strong>2002</strong>- <strong>2002</strong>-<br />
<strong>2002</strong> 1997 <strong>2001</strong><br />
PRODUÇÃO (t)<br />
Brasil 1.319.174 912.109 1.027.671 1.090.908 914.962 1.197.005 100,0 (9,3) 30,8<br />
Paraná 65.500 108.000 137.000 101.500 115.276 156.534 13,1 139,0 35,8<br />
Bahia 252.499 171.403 168.553 225.048 131.869 287.708 24,0 13,9 118,2<br />
Minas Gerais 145.709 111.252 125.915 128.347 128.245 165.207 13,8 13,4 28,8<br />
São Paulo 84.000 93.000 119.100 76.500 114.850 115.360 9,6 37,3 0,4<br />
Goiás 69.129 53.953 50.391 29.265 64.106 42.864 3,6 (38,0) (33,1)<br />
<strong>Santa</strong> <strong>Catarina</strong> 74.007 41.566 44.457 50.970 36.352 34.000 2,8 (54,1) (6,5)<br />
Rio Gran<strong>de</strong> do Sul 18.879 24.003 27.441 30.005 27.656 31.060 2,6 64,5 12,3<br />
Ceará 24.659 17.203 17.027 11.812 8.374 11.706 1,0 (52,5) 39,8<br />
ÁREA COLHIDA (ha)<br />
Brasil 2.160.997 1.295.220 1.559.816 1.693.574 1.217.790 1.486.913 100,0 (31,2) 22,1<br />
Paraná 65.500 93.000 117.000 81.490 81.445 111.810 7,5 70,7 37,3<br />
Bahia 395.597 265.554 282.084 365.287 263.732 388.158 26,1 (1,9) 47,2<br />
Minas Gerais 194.181 158.967 171.029 163.010 151.906 165.536 11,1 (14,8) 9,0<br />
São Paulo 80.000 83.900 108.300 70.400 87.000 87.020 5,9 8,8 0,0<br />
Goiás 59.477 46.699 70.499 26.524 49.705 36.159 2,4 (39,2) (27,3)<br />
<strong>Santa</strong> <strong>Catarina</strong> 91.985 66.158 76.151 54.875 38.666 41.000 2,8 (55,4) 6,0<br />
Rio Gran<strong>de</strong> do Sul 47.184 44.112 49.887 39.578 34.373 40.699 2,7 (13,7) 18,4<br />
Ceará 32.818 19.450 19.802 14.103 8.647 11.558 0,8 (64,8) 33,7<br />
RENDIMENTO (kg/ha)<br />
Brasil 610 704 659 644 751 805 100,0 32,0 7,2<br />
Paraná 1.000 1.161 1.171 1.246 1.415 1.400 173,9 40,0 (1,1)<br />
Bahia 638 645 598 616 500 741 92,0 16,1 48,2<br />
Minas Gerais 750 700 736 787 844 998 124,0 33,1 18,2<br />
São Paulo 1.050 1.108 1.100 1.087 1.320 1.326 164,7 26,3 0,5<br />
Goiás 1.162 1.155 715 1.103 1.290 1.185 147,2 2,0 (8,1)<br />
<strong>Santa</strong> <strong>Catarina</strong> 805 628 584 929 940 829 103,0 3,0 (11,8)<br />
Rio Gran<strong>de</strong> do Sul 400 544 550 758 805 763 94,8 90,8 (5,2)<br />
Ceará 751 884 860 838 968 1.013 125,8 34,9 4,6<br />
FONTE: IBGE.<br />
(1)<br />
Dados sujeitos a modificações.<br />
Síntese <strong>Anual</strong> <strong>da</strong> <strong>Agricultura</strong> <strong>de</strong> <strong>Santa</strong> <strong>Catarina</strong> >> <strong>2001</strong>-<strong>2002</strong><br />
45


