SÃntese Anual da Agricultura de Santa Catarina - 2001-2002 - Cepa
SÃntese Anual da Agricultura de Santa Catarina - 2001-2002 - Cepa
SÃntese Anual da Agricultura de Santa Catarina - 2001-2002 - Cepa
You also want an ePaper? Increase the reach of your titles
YUMPU automatically turns print PDFs into web optimized ePapers that Google loves.
setor florestal<br />
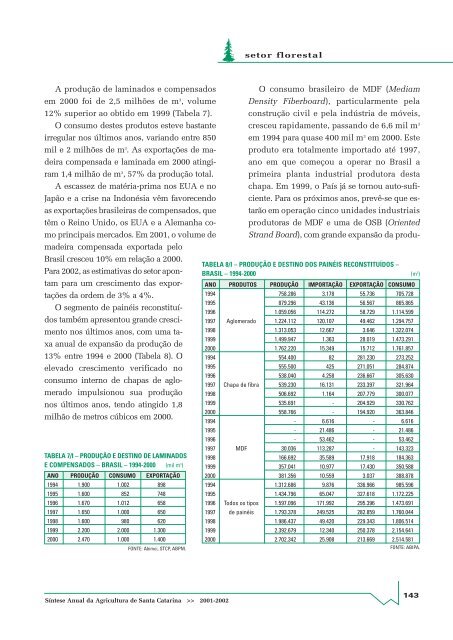
A produção <strong>de</strong> laminados e compensados<br />
em 2000 foi <strong>de</strong> 2,5 milhões <strong>de</strong> m 3 , volume<br />
12% superior ao obtido em 1999 (Tabela 7).<br />
O consumo <strong>de</strong>stes produtos esteve bastante<br />
irregular nos últimos anos, variando entre 850<br />
mil e 2 milhões <strong>de</strong> m 3 . As exportações <strong>de</strong> ma<strong>de</strong>ira<br />
compensa<strong>da</strong> e lamina<strong>da</strong> em 2000 atingiram<br />
1,4 milhão <strong>de</strong> m 3 , 57% <strong>da</strong> produção total.<br />
A escassez <strong>de</strong> matéria-prima nos EUA e no<br />
Japão e a crise na Indonésia vêm favorecendo<br />
as exportações brasileiras <strong>de</strong> compensados, que<br />
têm o Reino Unido, os EUA e a Alemanha como<br />
principais mercados. Em <strong>2001</strong>, o volume <strong>de</strong><br />
O consumo brasileiro <strong>de</strong> MDF (Mediam<br />
Density Fiberboard), particularmente pela<br />
construção civil e pela indústria <strong>de</strong> móveis,<br />
cresceu rapi<strong>da</strong>mente, passando <strong>de</strong> 6,6 mil m 3<br />
em 1994 para quase 400 mil m 3 em 2000. Este<br />
produto era totalmente importado até 1997,<br />
ano em que começou a operar no Brasil a<br />
primeira planta industrial produtora <strong>de</strong>sta<br />
chapa. Em 1999, o País já se tornou auto-suficiente.<br />
Para os próximos anos, prevê-se que estarão<br />
em operação cinco uni<strong>da</strong><strong>de</strong>s industriais<br />
produtoras <strong>de</strong> MDF e uma <strong>de</strong> OSB (Oriented<br />
Strand Board), com gran<strong>de</strong> expansão <strong>da</strong> produ-<br />
ma<strong>de</strong>ira compensa<strong>da</strong> exporta<strong>da</strong> pelo<br />
Brasil cresceu 10% em relação a 2000.<br />
TABELA 8/I – PRODUÇÃO E DESTINO DOS PAINÉIS RECONSTITUÍDOS –<br />
Para <strong>2002</strong>, as estimativas do setor apontam<br />
BRASIL – 1994-2000 (m 3 )<br />
para um crescimento <strong>da</strong>s expor-<br />
ANO PRODUTOS PRODUÇÃO IMPORTAÇÃO EXPORTAÇÃO CONSUMO<br />
tações <strong>da</strong> or<strong>de</strong>m <strong>de</strong> 3% a 4%.<br />
1994 758.286 3.178 55.736 705.728<br />
1995 879.296 43.136 56.567 865.865<br />
O segmento <strong>de</strong> painéis reconstituídos<br />
1996 1.059.056 114.272 58.729 1.114.599<br />
também apresentou gran<strong>de</strong> cresci-<br />
1997 Aglomerado 1.224.112 120.107 49.462 1.294.757<br />
mento nos últimos anos, com uma taxa<br />
1998 1.313.053 12.667 3.646 1.322.074<br />
anual <strong>de</strong> expansão <strong>da</strong> produção <strong>de</strong><br />
1999 1.499.947 1.363 28.019 1.473.291<br />
2000 1.762.220 15.349 15.712 1.761.857<br />
13% entre 1994 e 2000 (Tabela 8). O 1994 554.400 82 281.230 273.252<br />
elevado crescimento verificado no 1995 555.500 425 271.051 284.874<br />
1996 538.040 4.258 236.667 305.630<br />
consumo interno <strong>de</strong> chapas <strong>de</strong> aglomerado<br />
1997 Chapa <strong>de</strong> fibra 539.230 16.131 233.397 321.964<br />
impulsionou sua produção 1998 506.692 1.164 207.779 300.077<br />
nos últimos anos, tendo atingido 1,8 1999 535.691 - 204.929 330.762<br />
milhão <strong>de</strong> metros cúbicos em 2000.<br />
2000 558.766 - 194.920 363.846<br />
TABELA 7/I – PRODUÇÃO E DESTINO DE LAMINADOS<br />
E COMPENSADOS – BRASIL – 1994-2000 (mil m 3 )<br />
ANO PRODUÇÃO CONSUMO EXPORTAÇÃO<br />
1994 1.900 1.002 898<br />
1995 1.600 852 748<br />
1996 1.670 1.012 658<br />
1997 1.650 1.000 650<br />
1998 1.600 980 620<br />
1999 2.200 2.000 1.300<br />
2000 2.470 1.000 1.400<br />
FONTE: Abimci, STCP, ABPM.<br />
1994 - 6.616 - 6.616<br />
1995 - 21.486 - 21.486<br />
1996 - 53.462 - 53.462<br />
1997 MDF 30.036 113.287 - 143.323<br />
1998 166.692 35.589 17.918 184.363<br />
1999 357.041 10.977 17.430 350.588<br />
2000 381.356 10.559 3.037 388.878<br />
1994 1.312.686 9.876 336.966 985.596<br />
1995 1.434.796 65.047 327.618 1.172.225<br />
1996 Todos os tipos 1.597.096 171.992 295.396 1.473.691<br />
1997 <strong>de</strong> painéis 1.793.378 249.525 282.859 1.760.044<br />
1998 1.986.437 49.420 229.343 1.806.514<br />
1999 2.392.679 12.340 250.378 2.154.641<br />
2000 2.702.342 25.908 213.669 2.514.581<br />
FONTE: ABIPA.<br />
Síntese <strong>Anual</strong> <strong>da</strong> <strong>Agricultura</strong> <strong>de</strong> <strong>Santa</strong> <strong>Catarina</strong> >> <strong>2001</strong>-<strong>2002</strong><br />
143


