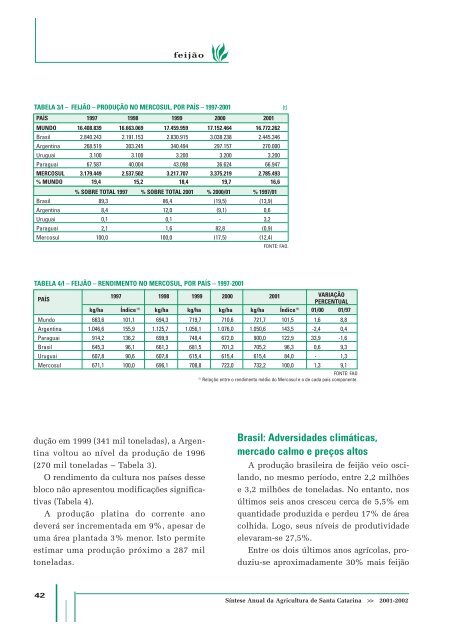
feijão TABELA 3/I – FEIJÃO – PRODUÇÃO NO MERCOSUL, POR PAÍS – 1997-<strong>2001</strong> (t) PAÍS 1997 1998 1999 2000 <strong>2001</strong> MUNDO 16.408.839 16.663.069 17.459.959 17.152.464 16.772.262 Brasil 2.840.243 2.191.153 2.830.915 3.038.238 2.445.346 Argentina 268.519 303.245 340.494 297.157 270.000 Uruguai 3.100 3.100 3.200 3.200 3.200 Paraguai 67.587 40.004 43.098 36.624 66.947 MERCOSUL 3.179.449 2.537.502 3.217.707 3.375.219 2.785.493 % MUNDO 19,4 15,2 18,4 19,7 16,6 % SOBRE TOTAL 1997 % SOBRE TOTAL <strong>2001</strong> % 2000/01 % 1997/01 Brasil 89,3 86,4 (19,5) (13,9) Argentina 8,4 12,0 (9,1) 0,6 Uruguai 0,1 0,1 - 3,2 Paraguai 2,1 1,6 82,8 (0,9) Mercosul 100,0 100,0 (17,5) (12,4) FONTE: FAO. TABELA 4/I – FEIJÃO – RENDIMENTO NO MERCOSUL, POR PAÍS – 1997-<strong>2001</strong> PAÍS 1997 1998 1999 2000 <strong>2001</strong> VARIAÇÃO PERCENTUAL kg/ha Índice (1) kg/ha kg/ha kg/ha kg/ha Índice (1) 01/00 01/97 Mundo 663,6 101,1 694,3 719,7 710,6 721,7 101,5 1,6 8,8 Argentina 1.046,6 155,9 1.125,7 1.056,1 1.076,0 1.050,6 143,5 -2,4 0,4 Paraguai 914,2 136,2 699,9 748,4 672,0 900,0 122,9 33,9 -1,6 Brasil 645,3 96,1 661,3 681,5 701,3 705,2 96,3 0,6 9,3 Uruguai 607,8 90,6 607,8 615,4 615,4 615,4 84,0 - 1,3 Mercosul 671,1 100,0 696,1 708,8 723,0 732,2 100,0 1,3 9,1 FONTE: FAO (1) Relação entre o rendimento médio do Mercosul e o <strong>de</strong> ca<strong>da</strong> país componente. dução em 1999 (341 mil tonela<strong>da</strong>s), a Argentina voltou ao nível <strong>da</strong> produção <strong>de</strong> 1996 (270 mil tonela<strong>da</strong>s – Tabela 3). O rendimento <strong>da</strong> cultura nos países <strong>de</strong>sse bloco não apresentou modificações significativas (Tabela 4). A produção platina do corrente ano <strong>de</strong>verá ser incrementa<strong>da</strong> em 9%, apesar <strong>de</strong> uma área planta<strong>da</strong> 3% menor. Isto permite estimar uma produção próximo a 287 mil tonela<strong>da</strong>s. Brasil: Adversi<strong>da</strong><strong>de</strong>s climáticas, mercado calmo e preços altos A produção brasileira <strong>de</strong> feijão veio oscilando, no mesmo período, entre 2,2 milhões e 3,2 milhões <strong>de</strong> tonela<strong>da</strong>s. No entanto, nos últimos seis anos cresceu cerca <strong>de</strong> 5,5% em quanti<strong>da</strong><strong>de</strong> produzi<strong>da</strong> e per<strong>de</strong>u 17% <strong>de</strong> área colhi<strong>da</strong>. Logo, seus níveis <strong>de</strong> produtivi<strong>da</strong><strong>de</strong> elevaram-se 27,5%. Entre os dois últimos anos agrícolas, produziu-se aproxima<strong>da</strong>mente 30% mais feijão 42 Síntese <strong>Anual</strong> <strong>da</strong> <strong>Agricultura</strong> <strong>de</strong> <strong>Santa</strong> <strong>Catarina</strong> >> <strong>2001</strong>-<strong>2002</strong>
feijão em área 22% maior. Em conseqüência, seu rendimento elevou-se 6,5%. A primeira safra (por critério do IBGE/LSPA) do corrente ano agrícola teve maior parcela <strong>de</strong> responsabili<strong>da</strong><strong>de</strong> nesse <strong>de</strong>sempenho. Ampliou sua produção em 39%, com relação à quanti<strong>da</strong><strong>de</strong> produzi<strong>da</strong> na primeira safra do ano agrícola 00/01, e em 20% nos seis anos mencionados. Estes números resultaram basicamente dos incrementos <strong>de</strong> 14,5% na produtivi<strong>da</strong><strong>de</strong> e <strong>de</strong> 0,6% na área colhi<strong>da</strong> no biênio; <strong>de</strong> 19% <strong>de</strong> produtivi<strong>da</strong><strong>de</strong> e <strong>de</strong> 22% <strong>da</strong> área no período maior (Tabela 5). Estes números não só revelaram limitações no processo <strong>de</strong> incorporação <strong>de</strong> tecnologia à produção, como também mostraram correlação direta com o comportamento <strong>de</strong> mercado do produto. Mas não só. Foram matiza<strong>da</strong>s ain<strong>da</strong> pelas ocorrências climáticas no Rio Gran<strong>de</strong> do Sul, em <strong>Santa</strong> <strong>Catarina</strong>, Minas Gerais e Goiás. Nesses dois últimos estados, condições climáticas favoráveis durante o <strong>de</strong>senvolvimento <strong>da</strong>s lavouras proporcionaram TABELA 5/I – FEIJÃO – VARIAÇÃO DA PRODUÇÃO, ÁREA COLHIDA E RENDIMENTO NO BRASIL E PRINCIPAIS ESTADOS – 1997-<strong>2002</strong> % SOBRE % SOBRE % % ESTADO 1997 1998 1999 2000 <strong>2001</strong> <strong>2002</strong> (1) BRASIL BRASIL <strong>2002</strong>- <strong>2002</strong>- 1997 <strong>2002</strong> 1997 <strong>2001</strong> PRODUÇÃO (t) Brasil 2.989.637 2.199.934 2.815.960 3.038.238 2.436.356 3.153.439 100,0 100,0 5,5 29,4 Paraná 475.458 494.558 570.289 473.084 462.675 619.623 15,9 19,6 30,3 33,9 Minas Gerais 350.762 338.966 381.215 407.097 387.596 482.044 11,7 15,3 37,4 24,4 Bahia 472.929 221.125 348.873 540.125 246.031 453.546 15,8 14,4 (4,1) 84,3 São Paulo 221.100 254.430 293.600 237.776 320.887 283.900 7,4 9,0 28,4 (11,5) Goiás 166.582 184.518 199.151 200.415 219.914 214.149 5,6 6,8 28,6 (2,6) Ceará 133.769 58.056 189.824 196.696 117.124 214.068 4,5 6,8 60,0 82,8 <strong>Santa</strong> <strong>Catarina</strong> 226.239 158.284 210.958 227.923 164.148 170.000 7,6 5,4 (24,9) 3,6 Rio Gran<strong>de</strong> do Sul 139.796 119.273 158.363 146.375 140.381 145.143 4,7 4,6 3,8 3,4 Subtotal 2.186.635 1.829.210 2.352.273 2.429.491 2.058.756 2.582.473 73,1 81,9 18,1 25,4B ÁREA COLHIDA (ha) Brasil 4.826.287 3.324.388 4.148.057 4.332.314 3.280.782 3.992.177 100,0 100,0 (17,3) 21,7 Bahia 807.578 439.777 652.154 826.693 556.941 772.237 16,7 19,3 (4,4) 38,7 Ceará 393.488 359.202 576.736 569.777 510.215 592.504 8,2 14,8 50,6 16,1 Paraná 554.838 564.538 632.500 537.069 453.958 553.063 11,5 13,9 (0,3) 21,8 Minas Gerais 451.806 432.595 454.444 436.329 405.453 416.353 9,4 10,4 (7,8) 2,7 São Paulo 212.870 208.390 261.500 211.700 219.625 210.920 4,4 5,3 (0,9) (4,0) Rio Gran<strong>de</strong> do Sul 186.701 181.202 197.083 181.713 147.868 165.691 3,9 4,2 (11,3) 12,1 <strong>Santa</strong> <strong>Catarina</strong> 237.664 212.204 240.379 212.799 143.441 153.000 4,9 3,8 (35,6) 6,7 RENDIMENTO (kg/ha) Brasil 619,4 661,8 678,9 701,3 742,6 789,9 100,0 100,0 27,5 6,4 Goiás 1.611,7 1.703,2 1.384,9 1.785,0 1.532,7 1.698,8 260,2 215,1 5,4 10,8 São Paulo 1.038,7 1.220,9 1.122,8 1.123,2 1.461,1 1.346,0 167,7 170,4 29,6 (7,9) Minas Gerais 776,4 783,6 838,9 933,0 956,0 1.157,8 125,3 146,6 49,1 21,1 Paraná 856,9 876,0 901,6 880,9 1.019,2 1.120,3 138,3 141,8 30,7 9,9 <strong>Santa</strong> <strong>Catarina</strong> 951,9 745,9 877,6 1.071,1 1.144,4 1.111,1 153,7 140,7 16,7 (2,9) Rio Gran<strong>de</strong> do Sul 748,8 658,2 803,5 805,5 949,4 876,0 120,9 110,9 17,0 (7,7) Bahia 585,6 502,8 535,0 653,4 441,8 587,3 94,5 74,4 0,3 33,0 Ceará 340,0 161,6 329,1 345,2 229,6 361,3 54,9 45,7 6,3 57,4 FONTE: IBGE. (1) Dados sujeitos a modificações. Síntese <strong>Anual</strong> <strong>da</strong> <strong>Agricultura</strong> <strong>de</strong> <strong>Santa</strong> <strong>Catarina</strong> >> <strong>2001</strong>-<strong>2002</strong> 43
- Page 2 and 3: INSTITUTO DE PLANEJAMENTO E ECONOMI
- Page 4 and 5: apresentação Oestado de Santa Cat
- Page 6 and 7: sumário DESEMPENHO DA PESCA ......
- Page 8 and 9: Parte 1 A CONJUNTURA ECONÔMICA EM
- Page 10 and 11: do. As responsabilidades pelos risc
- Page 12 and 13: A pecuária participa com pouco mai
- Page 14 and 15: crescentes, não foram suficientes
- Page 16 and 17: AS REGRAS PARA A SAFRA 02/03 Em 24
- Page 18 and 19: as regras para a safra 02/03 mento
- Page 20 and 21: Desempenho da produção vegetal AL
- Page 22 and 23: Santa Catarina continua sendo o seg
- Page 24 and 25: arroz Em termos de rendimento, por
- Page 26 and 27: arroz TABELA 4/I - ARROZ EM CASCA -
- Page 28 and 29: BANANA Dentre as frutas cultivadas
- Page 30 and 31: anana TABELA 2/I - BANANA - ÁREA P
- Page 32 and 33: anana forma, retardou a recuperaç
- Page 34 and 35: atata TABELA 1/I - BATATA - ÁREA P
- Page 36 and 37: CEBOLA Os dados de desempenho da ce
- Page 38 and 39: cebola GRÁFICO 3/I - CEBOLA - COMP
- Page 40 and 41: FEIJÃO Produção mundial estabili
- Page 44 and 45: feijão expectativa de níveis elev
- Page 46 and 47: feijão clínio de produtividade (-
- Page 48 and 49: feijão Estes números expressam:
- Page 50 and 51: feijão TABELA 11/I - FEIJÃO 2ª S
- Page 52 and 53: fumo Safra 01/02 - Situação do Su
- Page 54 and 55: fumo parte do seu custo de produç
- Page 56 and 57: MAÇÃ Aprodução brasileira de ma
- Page 58 and 59: potencial produtivo dos pomares já
- Page 60 and 61: mandioca Os países que mais import
- Page 62 and 63: mandioca se negativamente nos valor
- Page 64 and 65: No Litoral Sul Catarinense, os pre
- Page 66 and 67: mandioca / milho Perspectivas As pe
- Page 68 and 69: milho Entretanto, a perspectiva de
- Page 70 and 71: milho A perspectiva inicial de um s
- Page 72 and 73: milho TABELA 6/I - MILHO - ÁREA PL
- Page 74 and 75: soja Unidos, o mercado voltou a sub
- Page 76 and 77: soja (R$/sc) GRÁFICO 5/I - SOJA -
- Page 78 and 79: TOMATE Otomate é uma das mais impo
- Page 80 and 81: tomate portante no contexto naciona
- Page 82 and 83: quando a área plantada foi 5,5% ma
- Page 84 and 85: trigo TABELA 7/I - TRIGO - OFERTA E
- Page 86 and 87: trigo TABELA 13/I - TRIGO - PREÇOS
- Page 88 and 89: uva GRÁFICO 1/I - UVA - PARTICIPA
- Page 90 and 91: FLORES E PLANTAS ORNAMENTAIS Situa
- Page 92 and 93:
30,9%; floricultura-terceiros - 20,
- Page 94 and 95:
flores e plantas ornamentais lizado
- Page 96 and 97:
calendário agrícola QUADRO 1/I -
- Page 98 and 99:
carne de frango Panorama catarinens
- Page 100 and 101:
carne bovina GRÁFICO 2/I - CARNE B
- Page 102 and 103:
carne suína A produção catarinen
- Page 104 and 105:
carne suína / leite TABELA 3/I - A
- Page 106 and 107:
leite Dentre os outros países com
- Page 108 and 109:
leite TABELA 4/I - LEITE - PRODUÇ
- Page 110 and 111:
leite TABELA 10/I - LEITE E DERIVAD
- Page 112 and 113:
leite TABELA 14/I - LEITE - PREÇOS
- Page 114 and 115:
mel TABELA 1/I - MEL - QUANTIDADE T
- Page 116 and 117:
mel TABELA 5/I - MEL - VALOR DAS IM
- Page 118 and 119:
mel expressiva, usada mais para fin
- Page 120 and 121:
mel QUADRO 1/I - MEL - CALENDÁRIO
- Page 122 and 123:
Desempenho da pesca PESCA No Brasil
- Page 124 and 125:
pesca GRÁFICO 1/I - PESCADO - IMPO
- Page 126 and 127:
pesca Laguna vêm a seguir, com uma
- Page 128 and 129:
Desempenho da aqüicultura AQÜICUL
- Page 130 and 131:
piscicultura e garantindo a compra
- Page 132 and 133:
CAMARÃO MARINHO Acarcinicultura, n
- Page 134 and 135:
camarão marinho As exportações c
- Page 136 and 137:
moluscos GRÁFICO 1/I - PRODUÇÃO
- Page 138 and 139:
DESEMPENHO DO SETOR FLORESTAL Panor
- Page 140 and 141:
setor florestal quase todas as regi
- Page 142 and 143:
O Brasil tem uma posição importan
- Page 144 and 145:
setor florestal ção, do consumo e
- Page 146 and 147:
setor florestal A produção catari
- Page 148 and 149:
setor florestal portado pelos três
- Page 150 and 151:
setor florestal de madeiras, desenv
- Page 152 and 153:
parte 2 Continuação MUNICíPIO Á
- Page 154 and 155:
ARGENTINA Dionísio Cerqueira Guaru
- Page 156 and 157:
parte 2 TABELA 4/II - UMIDADE RELAT
- Page 158 and 159:
parte 2 TABELA 8/II - POPULAÇÃO R
- Page 160 and 161:
parte 2 Conclusão MUNICÍPIO POPUL
- Page 162 and 163:
parte 2 ESTRUTURA DE PRODUÇÃO E C
- Page 164 and 165:
parte 2 TABELA 17/II - MÁQUINAS AG
- Page 166 and 167:
parte 2 TABELA 23/II - EXPORTAÇÕE
- Page 168 and 169:
parte 2 TABELA 25/II - VALOR BRUTO
- Page 170 and 171:
parte 2 (conclusão) ANO MÊS ARROZ
- Page 172 and 173:
parte 2 TABELA 30/II - PREÇOS MÉD
- Page 174 and 175:
parte 2 TABELA 32/II - PREÇOS MÉD
- Page 176 and 177:
parte 2 TABELA 34/II - EQUIVALÊNCI
- Page 178 and 179:
anexo I Catanduvas Erval Velho MESO
- Page 180 and 181:
anexo II São Bonifácio ASSOCIAÇ
- Page 182 and 183:
anexo II / anexo III ASSOCIAÇÃO D
- Page 184 and 185:
anexo III REGIÃO HIDROGRÁFICA BAC
- Page 186 and 187:
anexo III RH-6 BAIXADA NORTE RIO CU
- Page 188 and 189:
anexo III REGIÃO HIDROGRÁFICA BAC
- Page 190 and 191:
anexo IV Produto - Resultado de qua
- Page 192 and 193:
LISTA DE GRÁFICOS ALHO 1. Preços
- Page 194 and 195:
lista de gráficos CARNE BOVINA 1.
- Page 196 and 197:
LISTA DE TABELAS A CONJUNTURA ECON
- Page 198 and 199:
lista de tabelas 7. Exportações c
- Page 200 and 201:
lista de tabelas DESEMPENHO DA PROD
- Page 202 and 203:
lista de tabelas 4. Produção mund
- Page 204:
ÍNDICE REMISSIVO Alho, 20-23 Aqüi