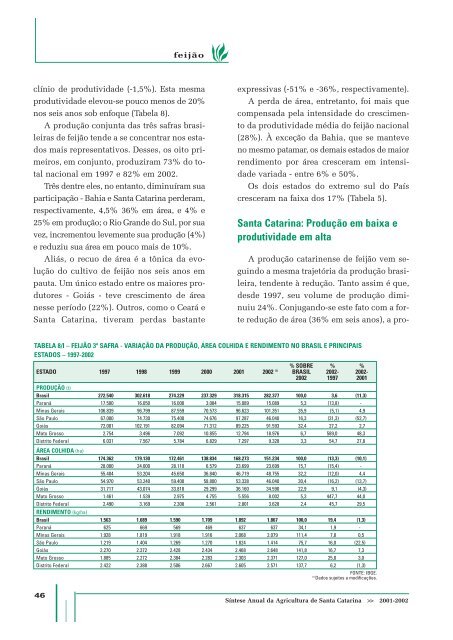
feijão clínio <strong>de</strong> produtivi<strong>da</strong><strong>de</strong> (-1,5%). Esta mesma produtivi<strong>da</strong><strong>de</strong> elevou-se pouco menos <strong>de</strong> 20% nos seis anos sob enfoque (Tabela 8). A produção conjunta <strong>da</strong>s três safras brasileiras <strong>de</strong> feijão ten<strong>de</strong> a se concentrar nos estados mais representativos. Desses, os oito primeiros, em conjunto, produziram 73% do total nacional em 1997 e 82% em <strong>2002</strong>. Três <strong>de</strong>ntre eles, no entanto, diminuíram sua participação - Bahia e <strong>Santa</strong> <strong>Catarina</strong> per<strong>de</strong>ram, respectivamente, 4,5% 36% em área, e 4% e 25% em produção; o Rio Gran<strong>de</strong> do Sul, por sua vez, incrementou levemente sua produção (4%) e reduziu sua área em pouco mais <strong>de</strong> 10%. Aliás, o recuo <strong>de</strong> área é a tônica <strong>da</strong> evolução do cultivo <strong>de</strong> feijão nos seis anos em pauta. Um único estado entre os maiores produtores - Goiás - teve crescimento <strong>de</strong> área nesse período (22%). Outros, como o Ceará e <strong>Santa</strong> <strong>Catarina</strong>, tiveram per<strong>da</strong>s bastante expressivas (-51% e -36%, respectivamente). A per<strong>da</strong> <strong>de</strong> área, entretanto, foi mais que compensa<strong>da</strong> pela intensi<strong>da</strong><strong>de</strong> do crescimento <strong>da</strong> produtivi<strong>da</strong><strong>de</strong> média do feijão nacional (28%). À exceção <strong>da</strong> Bahia, que se manteve no mesmo patamar, os <strong>de</strong>mais estados <strong>de</strong> maior rendimento por área cresceram em intensi<strong>da</strong><strong>de</strong> varia<strong>da</strong> - entre 6% e 50%. Os dois estados do extremo sul do País cresceram na faixa dos 17% (Tabela 5). <strong>Santa</strong> <strong>Catarina</strong>: Produção em baixa e produtivi<strong>da</strong><strong>de</strong> em alta A produção catarinense <strong>de</strong> feijão vem seguindo a mesma trajetória <strong>da</strong> produção brasileira, ten<strong>de</strong>nte à redução. Tanto assim é que, <strong>de</strong>s<strong>de</strong> 1997, seu volume <strong>de</strong> produção diminuiu 24%. Conjugando-se este fato com a forte redução <strong>de</strong> área (36% em seis anos), a pro- TABELA 8/I – FEIJÃO 3ª SAFRA - VARIAÇÃO DA PRODUÇÃO, ÁREA COLHIDA E RENDIMENTO NO BRASIL E PRINCIPAIS ESTADOS – 1997-<strong>2002</strong> % SOBRE % % ESTADO 1997 1998 1999 2000 <strong>2001</strong> <strong>2002</strong> (1) BRASIL <strong>2002</strong>- <strong>2002</strong>- <strong>2002</strong> 1997 <strong>2001</strong> PRODUÇÃO (t) Brasil 272.540 302.618 274.229 237.329 318.315 282.377 100,0 3,6 (11,3) Paraná 17.500 16.050 16.000 3.084 15.089 15.089 5,3 (13,8) - Minas Gerais 106.839 96.799 87.559 70.573 96.623 101.351 35,9 (5,1) 4,9 São Paulo 67.000 74.730 75.400 74.676 97.287 46.040 16,3 (31,3) (52,7) Goiás 72.001 102.191 82.094 71.312 89.225 91.593 32,4 27,2 2,7 Mato Grosso 2.754 3.496 7.092 10.855 12.794 18.976 6,7 589,0 48,3 Distrito Fe<strong>de</strong>ral 6.031 7.567 5.784 6.829 7.297 9.328 3,3 54,7 27,8 ÁREA COLHIDA (ha) Brasil 174.362 179.130 172.461 138.834 168.273 151.234 100,0 (13,3) (10,1) Paraná 28.000 24.000 28.110 6.579 23.699 23.699 15,7 (15,4) - Minas Gerais 55.404 53.204 45.650 36.840 46.719 48.755 32,2 (12,0) 4,4 São Paulo 54.970 53.240 59.400 58.800 53.338 46.040 30,4 (16,2) (13,7) Goiás 31.717 43.074 33.818 29.299 36.160 34.590 22,9 9,1 (4,3) Mato Grosso 1.461 1.539 2.975 4.755 5.556 8.002 5,3 447,7 44,0 Distrito Fe<strong>de</strong>ral 2.490 3.169 2.308 2.561 2.801 3.628 2,4 45,7 29,5 RENDIMENTO (kg/ha) Brasil 1.563 1.689 1.590 1.709 1.892 1.867 100,0 19,4 (1,3) Paraná 625 669 569 469 637 637 34,1 1,9 - Minas Gerais 1.928 1.819 1.918 1.916 2.068 2.079 111,4 7,8 0,5 São Paulo 1.219 1.404 1.269 1.270 1.824 1.414 75,7 16,0 (22,5) Goiás 2.270 2.372 2.428 2.434 2.468 2.648 141,8 16,7 7,3 Mato Grosso 1.885 2.272 2.384 2.283 2.303 2.371 127,0 25,8 3,0 Distrito Fe<strong>de</strong>ral 2.422 2.388 2.506 2.667 2.605 2.571 137,7 6,2 (1,3) FONTE: IBGE. (1) Dados sujeitos a modificações. 46 Síntese <strong>Anual</strong> <strong>da</strong> <strong>Agricultura</strong> <strong>de</strong> <strong>Santa</strong> <strong>Catarina</strong> >> <strong>2001</strong>-<strong>2002</strong>
feijão dutivi<strong>da</strong><strong>de</strong> cresceu quase 20%. Entre os dois últimos anos agrícolas, os excessos climáticos trouxeram redução <strong>da</strong> área colhi<strong>da</strong> e <strong>de</strong> produtivi<strong>da</strong><strong>de</strong> – a primeira cresceu apenas 6% e a segun<strong>da</strong> <strong>de</strong>clinou 3,5%. Em <strong>de</strong>corrência, a quanti<strong>da</strong><strong>de</strong> produzi<strong>da</strong> elevou-se pouco menos <strong>de</strong> 3%. As <strong>de</strong>z principais regiões, que produziram 91,5% do feijão estadual na produção <strong>de</strong> 01/02, mostraram recuo <strong>de</strong> 26% na quanti<strong>da</strong><strong>de</strong> produzi<strong>da</strong> e 38% <strong>de</strong> área. Por isso, seu rendimento médio subiu quase 20%. Nos dois últimos anos agrícolas, este mesmo rendimento baixou quase 2%, <strong>de</strong>vido ao crescimento <strong>de</strong> 2% na produção e à expansão <strong>de</strong> 4% na área (Tabela 9). TABELA 9/I – FEIJÃO TOTAL – PRODUÇÃO, ÁREA COLHIDA E RENDIMENTO NAS PRINCIPAIS MICRORREGIÕES GEOGRÁFICAS – SANTA CATARINA – 1997-<strong>2002</strong> % SOBRE % SOBRE % % MICRORREGIÃO 1997 1998 1999 2000 <strong>2001</strong> <strong>2002</strong> (1) SC SC <strong>2002</strong>- <strong>2002</strong>- GEOGRÁFICA 1997 <strong>2002</strong> 1997 <strong>2001</strong> PRODUÇÃO (t) <strong>Santa</strong> <strong>Catarina</strong> 226.239 158.284 210.958 227.923 166.456 171.870 100,0 100,0 (24,0) 3,3 Curitibanos 45.585 31.904 50.327 46.782 30.126 33.039 20,1 19,2 (27,5) 9,7 Canoinhas 13.733 18.098 23.528 30.619 17.238 30.454 6,1 17,7 121,8 76,7 Campos <strong>de</strong> Lages 27.652 22.424 26.475 22.996 24.304 25.511 12,2 14,8 (7,7) 5,0 Chapecó 69.185 25.663 40.669 46.157 27.377 22.474 30,6 13,1 (67,5) (17,9) Joaçaba 15.433 11.288 13.163 17.156 16.856 14.714 6,8 8,6 (4,7) (12,7) Xanxerê 9.104 8.162 11.705 17.259 11.044 9.195 4,0 5,3 1,0 (16,7) Criciúma 5.776 10.289 10.393 9.325 7.134 8.940 2,6 5,2 54,8 25,3 Tubarão 4.296 5.247 6.704 6.318 5.188 5.355 1,9 3,1 24,7 3,2 São Miguel do Oeste 12.893 5.389 7.373 10.453 8.742 5.346 5,7 3,1 (58,5) (38,8) Concórdia 8.445 4.694 4.195 5.711 6.109 2.188 3,7 1,3 (74,1) (64,2) Subtotal 212.102 143.158 194.532 212.776 154.118 157.216 93,8 91,5 (25,9) 2,0 Demais MRGs 14.137 15.126 16.426 15.147 12.338 14.654 6,2 8,5 3,7 18,8 ÁREA COLHIDA (ha) <strong>Santa</strong> <strong>Catarina</strong> 237.664 212.204 240.379 212.799 143.208 151.853 100,0 100,0 (36,1) 6,0 Chapecó 83.860 65.843 74.641 61.268 31.306 32.122 35,3 21,2 (61,7) 2,6 Campos <strong>de</strong> Lages 27.678 27.161 27.320 23.166 19.972 21.480 11,6 14,1 (22,4) 7,6 Curitibanos 34.280 26.333 34.147 29.767 21.220 21.205 14,4 14,0 (38,1) (0,1) Canoinhas 11.452 15.800 16.495 18.340 11.650 18.830 4,8 12,4 64,4 61,6 Joaçaba 13.091 12.335 11.964 12.825 12.091 10.772 5,5 7,1 (17,7) (10,9) São Miguel do Oeste 17.000 14.477 14.804 13.570 10.100 9.014 7,2 5,9 (47,0) (10,8) Criciúma 6.995 9.160 11.525 9.635 7.840 8.890 2,9 5,9 27,1 13,4 Xanxerê 11.052 9.608 12.658 13.508 7.280 6.616 4,7 4,4 (40,1) (9,1) Tubarão 6.363 6.245 7.640 6.955 5.300 6.106 2,7 4,0 (4,0) 15,2 Concórdia 10.510 8.288 8.628 8.860 6.190 3.068 4,4 2,0 (70,8) (50,4) Subtotal 222.281 195.250 219.822 197.894 132.949 138.103 93,5 90,9 (37,9) 3,9 Demais MRGs 15.383 16.954 20.557 14.905 10.256 13.750 6,5 9,1 (10,6) 34,1 RENDIMENTO (kg/ha) <strong>Santa</strong> <strong>Catarina</strong> 951,9 745,9 877,6 1.071,1 1.170,2 1.131,8 100,0 100,0 18,9 (3,3) Canoinhas 1.199,2 1.145,4 1.426,4 1.669,5 1.479,7 1.617,3 126,0 126,4 34,9 9,3 Curitibanos 1.329,8 1.211,6 1.473,8 1.571,6 1.419,7 1.558,1 139,7 121,3 17,2 9,7 Xanxerê 823,7 849,5 924,7 1.277,7 1.517,0 1.389,8 86,5 129,6 68,7 (8,4) Joaçaba 1.178,9 915,1 1.100,2 1.337,7 1.394,1 1.365,9 123,8 119,1 15,9 (2,0) Campos <strong>de</strong> Lages 999,1 825,6 969,1 992,7 1.216,9 1.187,7 105,0 104,0 18,9 (2,4) Criciúma 825,7 1.123,3 901,8 967,8 909,9 1.005,6 86,7 77,8 21,8 10,5 Tubarão 675,2 840,2 877,5 908,4 978,9 877,0 70,9 83,7 29,9 (10,4) Concórdia 803,5 566,4 486,2 644,6 986,9 713,2 84,4 84,3 (11,2) (27,7) Chapecó 825,0 389,8 544,9 753,4 874,5 699,6 86,7 74,7 (15,2) (20,0) São Miguel do Oeste 758,4 372,2 498,0 770,3 865,5 593,1 79,7 74,0 (21,8) (31,5) Subtotal 954,2 733,2 885,0 1.075,2 1.159,2 1.138,4 100,2 99,1 19,3 (1,8) Demais MRGs 919,0 892,2 799,0 1.016,2 1.203,0 1.065,7 96,5 102,8 16,0 (11,4) FONTE: IBGE. (1) Dados sujeitos a modificações. Síntese <strong>Anual</strong> <strong>da</strong> <strong>Agricultura</strong> <strong>de</strong> <strong>Santa</strong> <strong>Catarina</strong> >> <strong>2001</strong>-<strong>2002</strong> 47
- Page 2 and 3: INSTITUTO DE PLANEJAMENTO E ECONOMI
- Page 4 and 5: apresentação Oestado de Santa Cat
- Page 6 and 7: sumário DESEMPENHO DA PESCA ......
- Page 8 and 9: Parte 1 A CONJUNTURA ECONÔMICA EM
- Page 10 and 11: do. As responsabilidades pelos risc
- Page 12 and 13: A pecuária participa com pouco mai
- Page 14 and 15: crescentes, não foram suficientes
- Page 16 and 17: AS REGRAS PARA A SAFRA 02/03 Em 24
- Page 18 and 19: as regras para a safra 02/03 mento
- Page 20 and 21: Desempenho da produção vegetal AL
- Page 22 and 23: Santa Catarina continua sendo o seg
- Page 24 and 25: arroz Em termos de rendimento, por
- Page 26 and 27: arroz TABELA 4/I - ARROZ EM CASCA -
- Page 28 and 29: BANANA Dentre as frutas cultivadas
- Page 30 and 31: anana TABELA 2/I - BANANA - ÁREA P
- Page 32 and 33: anana forma, retardou a recuperaç
- Page 34 and 35: atata TABELA 1/I - BATATA - ÁREA P
- Page 36 and 37: CEBOLA Os dados de desempenho da ce
- Page 38 and 39: cebola GRÁFICO 3/I - CEBOLA - COMP
- Page 40 and 41: FEIJÃO Produção mundial estabili
- Page 42 and 43: feijão TABELA 3/I - FEIJÃO - PROD
- Page 44 and 45: feijão expectativa de níveis elev
- Page 48 and 49: feijão Estes números expressam:
- Page 50 and 51: feijão TABELA 11/I - FEIJÃO 2ª S
- Page 52 and 53: fumo Safra 01/02 - Situação do Su
- Page 54 and 55: fumo parte do seu custo de produç
- Page 56 and 57: MAÇÃ Aprodução brasileira de ma
- Page 58 and 59: potencial produtivo dos pomares já
- Page 60 and 61: mandioca Os países que mais import
- Page 62 and 63: mandioca se negativamente nos valor
- Page 64 and 65: No Litoral Sul Catarinense, os pre
- Page 66 and 67: mandioca / milho Perspectivas As pe
- Page 68 and 69: milho Entretanto, a perspectiva de
- Page 70 and 71: milho A perspectiva inicial de um s
- Page 72 and 73: milho TABELA 6/I - MILHO - ÁREA PL
- Page 74 and 75: soja Unidos, o mercado voltou a sub
- Page 76 and 77: soja (R$/sc) GRÁFICO 5/I - SOJA -
- Page 78 and 79: TOMATE Otomate é uma das mais impo
- Page 80 and 81: tomate portante no contexto naciona
- Page 82 and 83: quando a área plantada foi 5,5% ma
- Page 84 and 85: trigo TABELA 7/I - TRIGO - OFERTA E
- Page 86 and 87: trigo TABELA 13/I - TRIGO - PREÇOS
- Page 88 and 89: uva GRÁFICO 1/I - UVA - PARTICIPA
- Page 90 and 91: FLORES E PLANTAS ORNAMENTAIS Situa
- Page 92 and 93: 30,9%; floricultura-terceiros - 20,
- Page 94 and 95: flores e plantas ornamentais lizado
- Page 96 and 97:
calendário agrícola QUADRO 1/I -
- Page 98 and 99:
carne de frango Panorama catarinens
- Page 100 and 101:
carne bovina GRÁFICO 2/I - CARNE B
- Page 102 and 103:
carne suína A produção catarinen
- Page 104 and 105:
carne suína / leite TABELA 3/I - A
- Page 106 and 107:
leite Dentre os outros países com
- Page 108 and 109:
leite TABELA 4/I - LEITE - PRODUÇ
- Page 110 and 111:
leite TABELA 10/I - LEITE E DERIVAD
- Page 112 and 113:
leite TABELA 14/I - LEITE - PREÇOS
- Page 114 and 115:
mel TABELA 1/I - MEL - QUANTIDADE T
- Page 116 and 117:
mel TABELA 5/I - MEL - VALOR DAS IM
- Page 118 and 119:
mel expressiva, usada mais para fin
- Page 120 and 121:
mel QUADRO 1/I - MEL - CALENDÁRIO
- Page 122 and 123:
Desempenho da pesca PESCA No Brasil
- Page 124 and 125:
pesca GRÁFICO 1/I - PESCADO - IMPO
- Page 126 and 127:
pesca Laguna vêm a seguir, com uma
- Page 128 and 129:
Desempenho da aqüicultura AQÜICUL
- Page 130 and 131:
piscicultura e garantindo a compra
- Page 132 and 133:
CAMARÃO MARINHO Acarcinicultura, n
- Page 134 and 135:
camarão marinho As exportações c
- Page 136 and 137:
moluscos GRÁFICO 1/I - PRODUÇÃO
- Page 138 and 139:
DESEMPENHO DO SETOR FLORESTAL Panor
- Page 140 and 141:
setor florestal quase todas as regi
- Page 142 and 143:
O Brasil tem uma posição importan
- Page 144 and 145:
setor florestal ção, do consumo e
- Page 146 and 147:
setor florestal A produção catari
- Page 148 and 149:
setor florestal portado pelos três
- Page 150 and 151:
setor florestal de madeiras, desenv
- Page 152 and 153:
parte 2 Continuação MUNICíPIO Á
- Page 154 and 155:
ARGENTINA Dionísio Cerqueira Guaru
- Page 156 and 157:
parte 2 TABELA 4/II - UMIDADE RELAT
- Page 158 and 159:
parte 2 TABELA 8/II - POPULAÇÃO R
- Page 160 and 161:
parte 2 Conclusão MUNICÍPIO POPUL
- Page 162 and 163:
parte 2 ESTRUTURA DE PRODUÇÃO E C
- Page 164 and 165:
parte 2 TABELA 17/II - MÁQUINAS AG
- Page 166 and 167:
parte 2 TABELA 23/II - EXPORTAÇÕE
- Page 168 and 169:
parte 2 TABELA 25/II - VALOR BRUTO
- Page 170 and 171:
parte 2 (conclusão) ANO MÊS ARROZ
- Page 172 and 173:
parte 2 TABELA 30/II - PREÇOS MÉD
- Page 174 and 175:
parte 2 TABELA 32/II - PREÇOS MÉD
- Page 176 and 177:
parte 2 TABELA 34/II - EQUIVALÊNCI
- Page 178 and 179:
anexo I Catanduvas Erval Velho MESO
- Page 180 and 181:
anexo II São Bonifácio ASSOCIAÇ
- Page 182 and 183:
anexo II / anexo III ASSOCIAÇÃO D
- Page 184 and 185:
anexo III REGIÃO HIDROGRÁFICA BAC
- Page 186 and 187:
anexo III RH-6 BAIXADA NORTE RIO CU
- Page 188 and 189:
anexo III REGIÃO HIDROGRÁFICA BAC
- Page 190 and 191:
anexo IV Produto - Resultado de qua
- Page 192 and 193:
LISTA DE GRÁFICOS ALHO 1. Preços
- Page 194 and 195:
lista de gráficos CARNE BOVINA 1.
- Page 196 and 197:
LISTA DE TABELAS A CONJUNTURA ECON
- Page 198 and 199:
lista de tabelas 7. Exportações c
- Page 200 and 201:
lista de tabelas DESEMPENHO DA PROD
- Page 202 and 203:
lista de tabelas 4. Produção mund
- Page 204:
ÍNDICE REMISSIVO Alho, 20-23 Aqüi