

SÃntese Anual da Agricultura de Santa Catarina - 2001-2002 - Cepa
SÃntese Anual da Agricultura de Santa Catarina - 2001-2002 - Cepa
SÃntese Anual da Agricultura de Santa Catarina - 2001-2002 - Cepa

You also want an ePaper? Increase the reach of your titles
YUMPU automatically turns print PDFs into web optimized ePapers that Google loves.
leite<br />
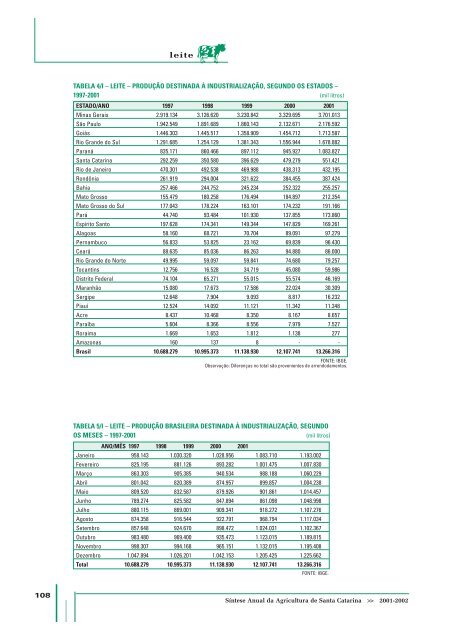
TABELA 4/I – LEITE – PRODUÇÃO DESTINADA À INDUSTRIALIZAÇÃO, SEGUNDO OS ESTADOS –<br />
1997-<strong>2001</strong> (mil litros)<br />
ESTADO/ANO 1997 1998 1999 2000 <strong>2001</strong><br />
Minas Gerais 2.919.134 3.126.620 3.230.842 3.329.695 3.701.013<br />
São Paulo 1.942.549 1.891.689 1.860.143 2.132.671 2.176.592<br />
Goiás 1.446.303 1.445.517 1.358.909 1.454.712 1.713.587<br />
Rio Gran<strong>de</strong> do Sul 1.291.685 1.254.129 1.381.343 1.556.944 1.678.882<br />
Paraná 835.171 860.466 897.112 945.927 1.083.827<br />
<strong>Santa</strong> <strong>Catarina</strong> 292.259 350.580 396.629 479.279 551.421<br />
Rio <strong>de</strong> Janeiro 470.301 492.538 469.988 438.313 432.195<br />
Rondônia 261.919 294.004 321.622 384.455 387.424<br />
Bahia 257.466 244.752 245.234 252.322 255.257<br />
Mato Grosso 155.479 180.258 176.494 184.897 212.354<br />
Mato Grosso do Sul 177.043 178.224 163.101 174.232 191.166<br />
Pará 44.740 93.484 101.930 137.855 173.860<br />
Espírito Santo 197.628 174.341 149.344 147.829 169.261<br />
Alagoas 58.160 68.721 70.704 89.091 97.279<br />
Pernambuco 56.833 53.825 23.162 69.839 96.430<br />
Ceará 88.635 85.036 86.263 94.880 86.000<br />
Rio Gran<strong>de</strong> do Norte 49.995 59.097 59.841 74.680 79.257<br />
Tocantins 12.756 16.528 34.719 45.080 59.986<br />
Distrito Fe<strong>de</strong>ral 74.104 65.271 55.015 55.574 46.169<br />
Maranhão 15.080 17.673 17.586 22.024 30.309<br />
Sergipe 12.648 7.904 9.093 8.817 16.232<br />
Piauí 12.524 14.092 11.121 11.342 11.348<br />
Acre 8.437 10.468 8.350 8.167 8.657<br />
Paraíba 5.604 8.366 8.556 7.979 7.527<br />
Roraima 1.669 1.653 1.812 1.138 277<br />
Amazonas 160 137 8 - -<br />
Brasil 10.688.279 10.995.373 11.138.930 12.107.741 13.266.316<br />
FONTE: IBGE.<br />
Observação: Diferenças no total são provenientes <strong>de</strong> arrendo<strong>da</strong>mentos.<br />
TABELA 5/I – LEITE – PRODUÇÃO BRASILEIRA DESTINADA À INDUSTRIALIZAÇÃO, SEGUNDO<br />
OS MESES – 1997-<strong>2001</strong><br />
(mil litros)<br />
ANO/MÊS 1997 1998 1999 2000 <strong>2001</strong><br />
Janeiro 958.143 1.030.320 1.028.956 1.083.710 1.193.002<br />
Fevereiro 825.195 881.126 893.282 1.001.475 1.007.830<br />
Março 863.303 905.385 940.534 988.188 1.060.229<br />
Abril 801.042 820.389 874.957 899.857 1.004.238<br />
Maio 809.520 832.587 879.926 901.861 1.014.457<br />
Junho 789.274 825.582 847.894 861.098 1.048.998<br />
Julho 880.115 869.001 909.341 918.272 1.107.276<br />
Agosto 874.358 916.544 922.791 968.794 1.117.034<br />
Setembro 857.648 924.670 898.472 1.024.031 1.102.367<br />
Outubro 983.480 969.400 935.473 1.123.015 1.189.815<br />
Novembro 998.307 994.168 965.151 1.132.015 1.195.408<br />
Dezembro 1.047.894 1.026.201 1.042.153 1.205.425 1.225.662<br />
Total 10.688.279 10.995.373 11.138.930 12.107.741 13.266.316<br />
FONTE: IBGE.<br />
108<br />
Síntese <strong>Anual</strong> <strong>da</strong> <strong>Agricultura</strong> <strong>de</strong> <strong>Santa</strong> <strong>Catarina</strong> >> <strong>2001</strong>-<strong>2002</strong>


