

SÃntese Anual da Agricultura de Santa Catarina - 2001-2002 - Cepa
SÃntese Anual da Agricultura de Santa Catarina - 2001-2002 - Cepa
SÃntese Anual da Agricultura de Santa Catarina - 2001-2002 - Cepa

Create successful ePaper yourself
Turn your PDF publications into a flip-book with our unique Google optimized e-Paper software.
parte 2<br />
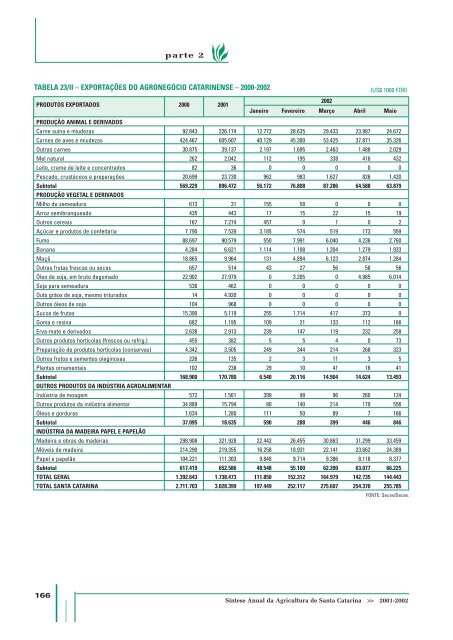
TABELA 23/II – EXPORTAÇÕES DO AGRONEGÓCIO CATARINENSE – 2000-<strong>2002</strong><br />
(US$ 1000 FOB)<br />
PRODUTOS EXPORTADOS 2000 <strong>2001</strong><br />
<strong>2002</strong><br />
Janeiro Fevereiro Março Abril Maio<br />
PRODUÇÃO ANIMAL E DERIVADOS<br />
Carne suína e miu<strong>de</strong>zas 92.843 226.174 12.772 28.635 29.433 23.987 24.672<br />
Carnes <strong>de</strong> aves e miu<strong>de</strong>zas 424.467 605.607 40.129 45.300 53.425 37.871 35.326<br />
Outras carnes 30.875 39.137 2.197 1.695 2.463 1.488 2.029<br />
Mel natural 262 2.042 112 195 338 416 432<br />
Leite, creme <strong>de</strong> leite e concentrados 82 36 0 0 0 0 0<br />
Pescado, crustáceos e preparações 20.699 23.730 962 983 1.627 826 1.420<br />
Subtotal 569.229 896.472 56.172 76.808 87.286 64.588 63.879<br />
PRODUÇÃO VEGETAL E DERIVADOS<br />
Milho <strong>de</strong> semeadura 613 31 155 58 0 0 0<br />
Arroz semibranqueado 435 443 17 15 22 15 19<br />
Outros cereais 167 7.274 457 0 1 0 2<br />
Açúcar e produtos <strong>de</strong> confeitaria 7.790 7.539 3.185 574 519 173 559<br />
Fumo 88.697 90.579 550 7.991 6.040 4.236 2.760<br />
Banana 4.284 6.621 1.114 1.108 1.204 1.279 1.933<br />
Maçã 18.865 9.964 131 4.894 6.123 2.874 1.284<br />
Outras frutas frescas ou secas 657 514 43 27 56 58 56<br />
Óleo <strong>de</strong> soja, em bruto <strong>de</strong>gomado 22.902 27.979 0 3.205 0 4.985 6.014<br />
Soja para semeadura 538 462 0 0 0 0 0<br />
Outs grãos <strong>de</strong> soja, mesmo triturados 14 4.920 0 0 0 0 0<br />
Outros óleos <strong>de</strong> soja 104 968 0 0 0 0 0<br />
Sucos <strong>de</strong> frutas 15.390 5.119 255 1.714 417 373 0<br />
Goma e resina 682 1.195 109 21 133 112 166<br />
Erva-mate e <strong>de</strong>rivados 2.638 2.913 239 147 119 232 258<br />
Outros produtos hortícolas (frescos ou refrig.) 455 382 5 5 4 0 73<br />
Preparação <strong>de</strong> produtos hortícolas (conservas) 4.342 3.505 249 344 214 268 323<br />
Outros frutos e sementes oleginosas 226 135 2 3 11 3 5<br />
Plantas ornamentais 102 238 29 10 41 16 41<br />
Subtotal 168.900 170.780 6.540 20.116 14.904 14.624 13.493<br />
OUTROS PRODUTOS DA INDÚSTRIA AGROALIMENTAR<br />
Indústria <strong>de</strong> moagem 572 1.561 399 98 96 260 124<br />
Outros produtos <strong>da</strong> indústria alimentar 34.889 15.794 80 140 214 179 556<br />
Óleos e gorduras 1.634 1.280 111 50 89 7 166<br />
Subtotal 37.095 18.635 590 288 399 446 846<br />
INDÚSTRIA DA MADEIRA PAPEL E PAPELÃO<br />
Ma<strong>de</strong>ira e obras <strong>de</strong> ma<strong>de</strong>iras 298.908 321.928 22.442 26.455 30.863 31.299 33.459<br />
Móveis <strong>de</strong> ma<strong>de</strong>ira 214.290 219.355 16.258 18.931 22.141 23.662 24.389<br />
Papel e papelão 104.221 111.303 9.848 9.714 9.386 8.116 8.377<br />
Subtotal 617.419 652.586 48.548 55.100 62.390 63.077 66.225<br />
TOTAL GERAL 1.392.643 1.738.473 111.850 152.312 164.979 142.735 144.443<br />
TOTAL SANTA CATARINA 2.711.703 3.028.399 197.449 252.117 275.607 254.370 255.785<br />
FONTE: Secex/Decex.<br />
166<br />
Síntese <strong>Anual</strong> <strong>da</strong> <strong>Agricultura</strong> <strong>de</strong> <strong>Santa</strong> <strong>Catarina</strong> >> <strong>2001</strong>-<strong>2002</strong>


