conference schedule and program with abstracts - Horticulture ...
conference schedule and program with abstracts - Horticulture ...
conference schedule and program with abstracts - Horticulture ...

You also want an ePaper? Increase the reach of your titles
YUMPU automatically turns print PDFs into web optimized ePapers that Google loves.
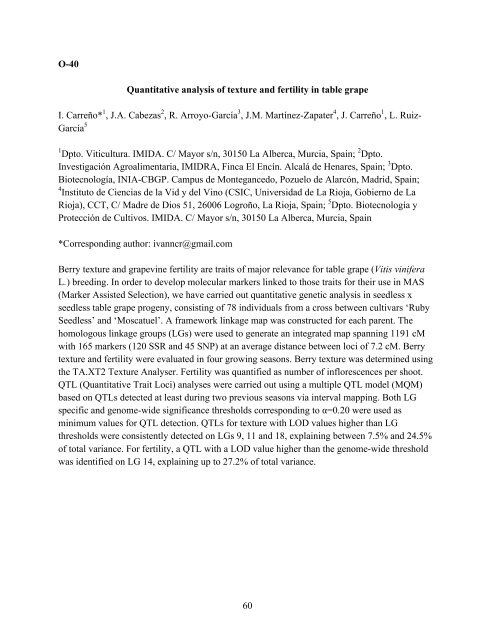
O-40<br />
Quantitative analysis of texture <strong>and</strong> fertility in table grape<br />
I. Carreño* 1 , J.A. Cabezas 2 , R. Arroyo-García 3 , J.M. Martínez-Zapater 4 , J. Carreño 1 , L. Ruiz-<br />
García 5<br />
1 Dpto. Viticultura. IMIDA. C/ Mayor s/n, 30150 La Alberca, Murcia, Spain; 2 Dpto.<br />
Investigación Agroalimentaria, IMIDRA, Finca El Encín. Alcalá de Henares, Spain; 3 Dpto.<br />
Biotecnología, INIA-CBGP. Campus de Montegancedo, Pozuelo de Alarcón, Madrid, Spain;<br />
4 Instituto de Ciencias de la Vid y del Vino (CSIC, Universidad de La Rioja, Gobierno de La<br />
Rioja), CCT, C/ Madre de Dios 51, 26006 Logroño, La Rioja, Spain; 5 Dpto. Biotecnología y<br />
Protección de Cultivos. IMIDA. C/ Mayor s/n, 30150 La Alberca, Murcia, Spain<br />
*Corresponding author: ivanncr@gmail.com<br />
Berry texture <strong>and</strong> grapevine fertility are traits of major relevance for table grape (Vitis vinifera<br />
L.) breeding. In order to develop molecular markers linked to those traits for their use in MAS<br />
(Marker Assisted Selection), we have carried out quantitative genetic analysis in seedless x<br />
seedless table grape progeny, consisting of 78 individuals from a cross between cultivars ‘Ruby<br />
Seedless’ <strong>and</strong> ‘Moscatuel’. A framework linkage map was constructed for each parent. The<br />
homologous linkage groups (LGs) were used to generate an integrated map spanning 1191 cM<br />
<strong>with</strong> 165 markers (120 SSR <strong>and</strong> 45 SNP) at an average distance between loci of 7.2 cM. Berry<br />
texture <strong>and</strong> fertility were evaluated in four growing seasons. Berry texture was determined using<br />
the TA.XT2 Texture Analyser. Fertility was quantified as number of inflorescences per shoot.<br />
QTL (Quantitative Trait Loci) analyses were carried out using a multiple QTL model (MQM)<br />
based on QTLs detected at least during two previous seasons via interval mapping. Both LG<br />
specific <strong>and</strong> genome-wide significance thresholds corresponding to α=0.20 were used as<br />
minimum values for QTL detection. QTLs for texture <strong>with</strong> LOD values higher than LG<br />
thresholds were consistently detected on LGs 9, 11 <strong>and</strong> 18, explaining between 7.5% <strong>and</strong> 24.5%<br />
of total variance. For fertility, a QTL <strong>with</strong> a LOD value higher than the genome-wide threshold<br />
was identified on LG 14, explaining up to 27.2% of total variance.<br />
60