- Page 1 and 2: Kitsap County Washington
- Page 3 and 4: KITSAP COUNTY 2009 BUDGET Approved
- Page 5 and 6: The Government Finance Officers Ass
- Page 7 and 8: T A B L E O F C O N T E N T S Page
- Page 9: KITSAP COUNTY OFFICIALS ELECTED OFF
- Page 12 and 13: County Mission Kitsap County govern
- Page 14 and 15: This page intentionally left blank
- Page 16 and 17: This page intentionally left blank
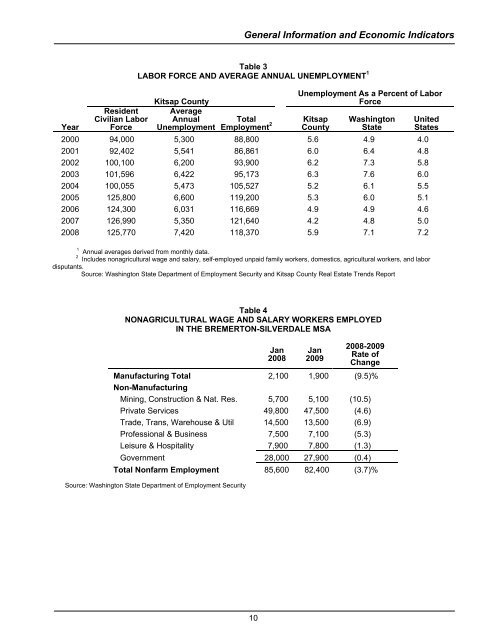
- Page 18 and 19: General Information and Economic In
- Page 22 and 23: General Information and Economic In
- Page 24 and 25: General Information and Economic In
- Page 26 and 27: General Information and Economic In
- Page 28 and 29: General Information and Economic In
- Page 30: This page intentionally left blank
- Page 34 and 35: BUDGET OVERVIEW Reconciliation of C
- Page 36 and 37: This page intentionally left blank
- Page 38 and 39: This page intentionally left blank
- Page 40: 2010 Annual Budget Calendar Revised
- Page 51 and 52: GENERAL FUND $88,404,529 Revenue Fi
- Page 53 and 54: ADMINISTRATIVE SERVICES II. Purpose
- Page 55 and 56: ADMINISTRATIVE SERVICES Performance
- Page 57 and 58: ADMINISTRATIVE SERVICES Expenditure
- Page 59 and 60: ADMINISTRATIVE SERVICES Program: De
- Page 61 and 62: ADMINISTRATIVE SERVICES Expenditure
- Page 63 and 64: ADMINISTRATIVE SERVICES Performance
- Page 65 and 66: ADMINISTRATIVE SERVICES Program: De
- Page 67 and 68: ADMINISTRATIVE SERVICES Agency Stru
- Page 69 and 70: ASSESSOR Historical Trends/Industry
- Page 71 and 72:
ASSESSOR 2006 2007 2008 2009 Worklo
- Page 73 and 74:
AUDITOR II. Purpose: The County Aud
- Page 75 and 76:
AUDITOR IV. 2009 Goals and Objectiv
- Page 77 and 78:
AUDITOR Expenses 2009 Budget Salari
- Page 79 and 80:
AUDITOR Performance Measures: (Note
- Page 81 and 82:
AUDITOR Program: Description: Initi
- Page 83 and 84:
AUDITOR Agency Structure: 67
- Page 85 and 86:
CLERK Historical Court Service Leve
- Page 87 and 88:
CLERK • We will contribute to Inc
- Page 89 and 90:
CLERK Expenditures: 2006 Actual Off
- Page 91 and 92:
BOARD OF COMMISSIONERS II. Purpose:
- Page 93 and 94:
BOARD OF COMMISSIONERS Agency Struc
- Page 95 and 96:
CORONER Historical Trends/Industry
- Page 97 and 98:
CORONER Agency Structure: Coroner C
- Page 99 and 100:
DISTRICT COURT Trends 1,000 - 5,500
- Page 101 and 102:
DISTRICT COURT We will contribute t
- Page 103 and 104:
DISTRICT COURT STAFFING LEVEL Perfo
- Page 105 and 106:
GENERAL ADMINISTRATION & OPERATIONS
- Page 107 and 108:
JAIL o Kitchen maintenance and repa
- Page 109 and 110:
STAFFING LEVEL Full Time Equivalent
- Page 111 and 112:
Expenditures: Agency Structure: DEP
- Page 113 and 114:
JUVENILE SERVICES Historical Trends
- Page 115 and 116:
JUVENILE SERVICES Initiatives: 1. A
- Page 117 and 118:
JUVENILE SERVICES devoted to assess
- Page 119 and 120:
JUVENILE SERVICES Program Notes: A)
- Page 121 and 122:
JUVENILE SERVICES Agency Structure:
- Page 123 and 124:
PARKS AND RECREATION II. III. IV. P
- Page 125 and 126:
PARKS AND RECREATION PROGRAM BUDGET
- Page 127 and 128:
PARKS AND RECREATION PROGRAM BUDGET
- Page 129 and 130:
PERSONNEL AND HUMAN SERVICES I. Bud
- Page 131 and 132:
PERSONNEL AND HUMAN SERVICES IV. 20
- Page 133 and 134:
PERSONNEL AND HUMAN SERVICES 2007 A
- Page 135 and 136:
PERSONNEL AND HUMAN SERVICES Initia
- Page 137 and 138:
PERSONNEL AND HUMAN SERVICES Perfor
- Page 139 and 140:
PERSONNEL AND HUMAN SERVICES Effici
- Page 141 and 142:
PERSONNEL AND HUMAN SERVICES Agency
- Page 143 and 144:
PROSECUTING ATTORNEY • Collection
- Page 145 and 146:
PROSECUTING ATTORNEY STAFFING LEVEL
- Page 147 and 148:
PROSECUTING ATTORNEY STAFFING LEVEL
- Page 149 and 150:
SHERIFF CRIME STATS COMPARISONS 200
- Page 151 and 152:
SHERIFF o Upgraded to three new enf
- Page 153 and 154:
SHERIFF Program: Civil Division Des
- Page 155 and 156:
SHERIFF Program: Patrol Description
- Page 157 and 158:
SHERIFF Expenditures: 2009 Budget S
- Page 159 and 160:
SHERIFF Expenditures: 2009 Budget S
- Page 161 and 162:
SUPERIOR COURT I. Budget Overview E
- Page 163 and 164:
SUPERIOR COURT V. Program Overview
- Page 165 and 166:
SUPERIOR COURT Initiatives: 1. Oper
- Page 167 and 168:
SUPERIOR COURT Agency Structure: Ci
- Page 169 and 170:
TREASURER • Anticipated increase
- Page 171 and 172:
TREASURER Performance Measures: STA
- Page 173 and 174:
WSU EXTENSION SERVICES I. Budget Ov
- Page 175 and 176:
WSU EXTENSION SERVICES V. Program O
- Page 177 and 178:
SPECIAL REVENUE FUNDS $132,242,613
- Page 179 and 180:
ADMINISTRATIVE SERVICES Efficiency
- Page 181 and 182:
ADMINISTRATIVE SERVICES Program: De
- Page 183 and 184:
BLOCK GRANT ENTITLEMENT FUND Initia
- Page 185 and 186:
CENTRAL COMMUNICATIONS I. Budget Ov
- Page 187 and 188:
CENTRAL COMMUNICATIONS IV. 2009 Goa
- Page 189 and 190:
COMMUNITY DEVELOPMENT I. Budget Ove
- Page 191 and 192:
COMMUNITY DEVELOPMENT 3. Maintain o
- Page 193 and 194:
COMMUNITY DEVELOPMENT STAFFING LEVE
- Page 195 and 196:
COMMUNITY DEVELOPMENT Performance M
- Page 197 and 198:
COMMUNITY DEVELOPMENT Workload 2006
- Page 199 and 200:
COMMUNITY DEVELOPMENT Performance M
- Page 201 and 202:
COMMUNITY DEVELOPMENT STAFFING LEVE
- Page 203 and 204:
COMMUNITY DEVELOPMENT PROGRAM BUDGE
- Page 205 and 206:
COMMUNITY DEVELOPMENT Agency Struct
- Page 207 and 208:
EMERGENCY MANAGEMENT • Fully impl
- Page 209 and 210:
EMERGENCY MANAGEMENT KPREP (1061) i
- Page 211 and 212:
HUMAN SERVICES I. Budget Overview S
- Page 213 and 214:
HUMAN SERVICES II. 2009 Goals and O
- Page 215 and 216:
HUMAN SERVICES Performance Measures
- Page 217 and 218:
HUMAN SERVICES 2005 Actual 2006 Act
- Page 219 and 220:
HUMAN SERVICES Program Notes: Chang
- Page 221 and 222:
HUMAN SERVICES 2008 Accomplishment:
- Page 223 and 224:
HUMAN SERVICES PROGRAM BUDGET Reven
- Page 225 and 226:
HUMAN SERVICES PROGRAM BUDGET Reven
- Page 227 and 228:
HUMAN SERVICES PROGRAM BUDGET Reven
- Page 229 and 230:
HUMAN SERVICES Human Services Divis
- Page 231 and 232:
PUBLIC WORKS ROADS III. IV. 2008 AC
- Page 233 and 234:
PUBLIC WORKS ROADS 10. Inspect and
- Page 235 and 236:
PUBLIC WORKS ROADS Performance Meas
- Page 237 and 238:
PUBLIC WORKS ROADS STAFFING LEVEL A
- Page 239 and 240:
223 PUBLIC WORKS ROADS
- Page 241 and 242:
OTHER SPECIAL REVENUE FUNDS 00145 P
- Page 243 and 244:
ENTERPRISE FUNDS $67,090,965 SSWM P
- Page 245 and 246:
PUBLIC WORKS SOLID WASTE Garbage an
- Page 247 and 248:
STAFFING LEVEL Full Time Equivalent
- Page 249 and 250:
STAFFING LEVEL Full Time Equivalent
- Page 251 and 252:
PUBLIC WORKS SOLID WASTE Workload 2
- Page 253 and 254:
PUBLIC WORKS SOLID WASTE Program Ov
- Page 255 and 256:
Agency Structure: TRANSFER STATION
- Page 257 and 258:
PUBLIC WORKS SEWER UTILITY II. Purp
- Page 259 and 260:
PUBLIC WORKS SEWER UTILITY Program:
- Page 261 and 262:
PUBLIC WORKS SEWER UTILITY Program:
- Page 263 and 264:
PUBLIC WORKS SEWER UTILITY DEPARTME
- Page 265 and 266:
SURFACE & STORMWATER MANAGEMENT I.
- Page 267 and 268:
SURFACE & STORMWATER MANAGEMENT •
- Page 269 and 270:
SURFACE & STORMWATER MANAGEMENT Per
- Page 271 and 272:
SURFACE & STORMWATER MANAGEMENT Pro
- Page 273 and 274:
SURFACE & STORMWATER MANAGEMENT Per
- Page 275 and 276:
SURFACE & STORMWATER MANAGEMENT Far
- Page 277 and 278:
SURFACE & STORMWATER MANAGEMENT PRO
- Page 279 and 280:
OTHER ENTERPRISE FUNDS Fund Expense
- Page 281 and 282:
INTERNAL SERVICE FUNDS $20,865,277
- Page 283 and 284:
PUBLIC WORKS EQUIPMENT RENTAL & REV
- Page 285 and 286:
INFORMATION SERVICES I. Budget Over
- Page 287 and 288:
INFORMATION SERVICES o SECTOR paper
- Page 289 and 290:
INFORMATION SERVICES The major cate
- Page 291 and 292:
INFORMATION SERVICES 3. Project & M
- Page 293 and 294:
RISK MANAGEMENT II. Purpose: The Ri
- Page 295 and 296:
DEBT SERVICE FUNDS $11,013,455 LTGO
- Page 297 and 298:
DEBT SERVICE FUNDS Year Purpose 199
- Page 299 and 300:
DEBT SERVICE REQUIREMENTS FOR LTGO
- Page 301 and 302:
Public Works Debt Service Funds for
- Page 303 and 304:
CAPITAL PROJECT FUNDS $8,534,158 20
- Page 305 and 306:
CAPITAL PROJECT FUNDS Revenue: This
- Page 307 and 308:
Parks Capital Projects Gordon Field
- Page 309 and 310:
Appendices
- Page 311 and 312:
Appendix A Policies Budget Policy T
- Page 313 and 314:
Appendix A Policies Investment Poli
- Page 315 and 316:
Appendix A Policies Collateral is t
- Page 317 and 318:
Appendix A Policies Debt Policy Res
- Page 319 and 320:
Appendix A Policies The County will
- Page 321 and 322:
Appendix A Policies other tax law r
- Page 323 and 324:
Appendix B Glossary G L O S S A R Y
- Page 325 and 326:
Appendix B Glossary ESA - Endangere
- Page 327 and 328:
Appendix B Glossary RESOLUTION - A
- Page 329 and 330:
Appendix C Tax Levies 2008 KITSAP C
- Page 331 and 332:
Appendix C Tax Levies T.E.D. = Timb
- Page 333 and 334:
Appendix D Synopsis of Property Tax
- Page 335 and 336:
Appendix D Synopsis of Property Tax
- Page 337 and 338:
Appendix E General Administration &
- Page 339 and 340:
Appendix F Staffing Levels KITSAP C
- Page 341 and 342:
Appendix F Staffing Levels KITSAP C
- Page 343 and 344:
Appendix F Staffing Levels KITSAP C
- Page 345 and 346:
Appendix F Staffing Levels KITSAP C
- Page 347 and 348:
Appendix F Staffing Levels KITSAP C
- Page 349 and 350:
Appendix F Staffing Levels KITSAP C
- Page 351 and 352:
Appendix F Staffing Levels KITSAP C
- Page 353 and 354:
Appendix F Staffing Levels KITSAP C
- Page 355 and 356:
Appendix F Staffing Levels KITSAP C
- Page 357 and 358:
Appendix F Staffing Levels KITSAP C
- Page 359 and 360:
TAXES KITSAP COUNTY GENERAL FUND RE
- Page 361 and 362:
Appendix H Statement of Changes in
- Page 363 and 364:
Appendix I 6 Year Public Buildings
- Page 365 and 366:
Major Revenue Sources Appendix J Ge