ASi" kUCTURE FlOR DEVELOPMENT
ASi" kUCTURE FlOR DEVELOPMENT
ASi" kUCTURE FlOR DEVELOPMENT
Create successful ePaper yourself
Turn your PDF publications into a flip-book with our unique Google optimized e-Paper software.
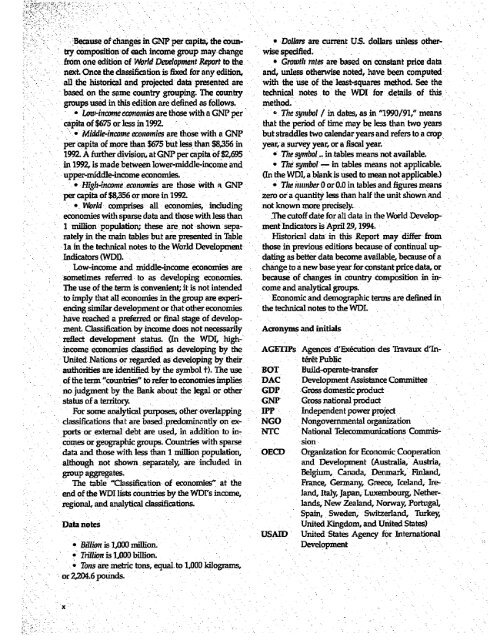
Because of changes in GNP per capita, the coun- * Dollars are current U.S. dollars unless othertry<br />
composition of each income group may change wise specified.<br />
from one edition of World Development Report to the * Growtht rates are based on constant price data.<br />
: next. Once the classification is fixed for any edition, and, unless otherwise noted, have been computed<br />
all the historical and projected data presented are with the use of the least-squares method. See the<br />
based on the same country grouping. The country technical notes to the WDI for details of this<br />
groups used in this edition are defined as follows. method.<br />
-* Lo-incomeeconomnies are those with a GNP per .The symbol J in dates, as in "'1990/91,' means<br />
capita of $675 or less in 1992.<br />
that the period of time may be less than two years<br />
- Middle-income economnies are those with a CNP but straddles two calendar years and refers to a crop<br />
per capita of more than $675 but less than $8,356 in year, a survey year, or a fiscal year.<br />
1992. A further division, at ONP per capita of $2,695 * The symbol.. in tables means not available.<br />
in 1992, is made between lower-middle-income and * 77w symbol - in tables means not applicable.<br />
upper-middle-incomeconomies.<br />
(In the WOI, a blank is used to mean not applicable.)<br />
* High-incomeconomies are those with a ON? * The number 0 or 0.0 in tables and figures means<br />
per capita of $8,356 or more in 1992.<br />
zero or a quantity less than half the unit shown and<br />
* World comprises all economies, including not known more precisely.<br />
economies with sparse data and those with less than .The cutoff date for all data in the World Develop-<br />
1 million pDpulation; these are not -shown sepa- ment Indicators is April 29,1994.<br />
rately in the main tables but are presented in Table Historical data in this Report may differ from<br />
la in the teclnical notes to the World Development those in previous editions because of continual up-<br />
Indicators (WDI).<br />
dating as better data become available, because of a<br />
Low-income and middle-income economnies are change to a new base year for constant price data, or<br />
'sometimes referred to as developing economies. because of changes in country composition in in-<br />
The use of the term is convenient; it is not intended come and analytical groups.<br />
to imply that al economies in the group are expen- Economic and demographic terms are defined in<br />
encing similar development or that other economies the technical notes to the WDI.<br />
have reached a preferred or final stage of development<br />
Classification by income does not necessarily Acronyms and initials<br />
-reflect development status. (In the WDI, highincome<br />
economies classified as developing by the AGETIPs Agences d'Execution des Travaux d'In-<br />
United Nations or regarded as developing by their<br />
ter&t Pubic<br />
authorities are identified by the symbol t). The use BOT Build-operate-transfer<br />
of the term "countries" to refer to economnies implies DAC Development Assistance Committee<br />
no judgment by the Bank about the legal or other GDP Gross domestic product<br />
status of a territory. GNP Gross national product<br />
For some analytical purposes, other overlapping IPP Independent power project<br />
classifications that are based predominantly on ex- NGO Nongovernmental organization<br />
ports or external debt are used, in addition to in- NTC National Telecommunications Commis<br />
comes or geographic groups. Countries with sparse<br />
sion<br />
data and those with less than I million population, OECD Organization for Economic Cooperation<br />
although not shown separately, are included in<br />
and Development (Australia, Austria,<br />
group aggregates.<br />
Belgium, Canada, Deenmark,' Fmland,<br />
The table "Classification of economies" at the<br />
France, Germany, Greece, Iceland, reend<br />
of the WDI lists countries by the WDrs income,<br />
land, Italy, Japan, Luxembourg, Netherregional,<br />
and analytical classifications-<br />
lands, New Zealand, Norway, Portugal,<br />
Spain, Sweden, Switzerland, Turkey,<br />
Data notes<br />
United Kingdom, and United States)<br />
USAID United States Agency for International<br />
* Billion is 1,000 million.<br />
Development<br />
T* rillion is 1,000 billion.<br />
9.* Ts are metric tons, equal. to 1,000 kilograms,<br />
or 2,204.6 pounds.<br />
x


