ASi" kUCTURE FlOR DEVELOPMENT
ASi" kUCTURE FlOR DEVELOPMENT
ASi" kUCTURE FlOR DEVELOPMENT
You also want an ePaper? Increase the reach of your titles
YUMPU automatically turns print PDFs into web optimized ePapers that Google loves.
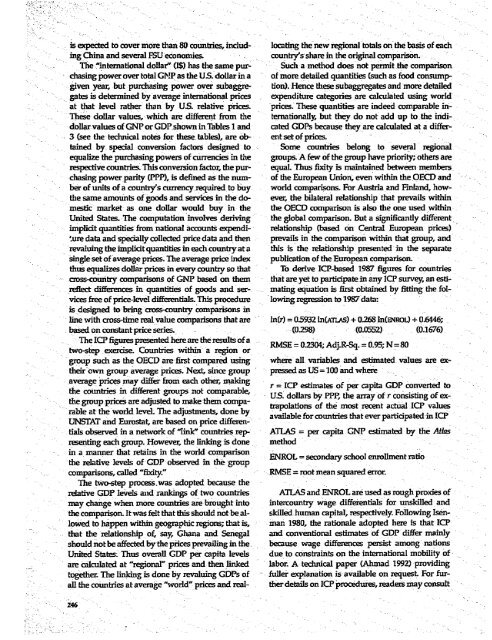
is expected to cover more than 80 countries, includ- locating the new regional totals on the basis of each<br />
ing China and several PSU econoriues.<br />
country's share in the original companson.<br />
The -international dollar" (l$) has the same pur- Such a method does not permit.the comparison<br />
chasing power over total GNP as the US. dollar in a of more detailed quantities (such as food consumpgiven<br />
year but purchasing power over subaggre- tion). Hence these subaggregates and more detailed<br />
gates is determined by average international prices expenditure categories are calculated using world<br />
at that level rather than by US. relative prices. prices. These quantities are indeed comparable in-<br />
These dollar values, which are different from the ternationally, but they do not add up to. the indidollar<br />
values of GNP or GDP.shown in Tables 1 and cated GDPs because they are calculated at a differ-<br />
3 (see the technical notes for these- tables), are ob- ent set of pnces.-<br />
taned by. special conversion factors designed to Some countries belong to several regional<br />
equalize the purchasing powers of currencies m the groups. A few of the group have priority; others are<br />
respective countries. This conversion factor, the pur- equal. Thus fudty is maintained between members<br />
chasing power parity (PPP), is defined as the num- of the European Union, even within the OECD and<br />
ber of units of a country's currency.required to buy world comparisons. For Austria and Finland, howthe<br />
same amounts of goods and services in the do- ever, the bilateral relationship that prevails within<br />
mestic market as one dollar would buy in the the OECD comparison is also the one used within<br />
United States. The computation involves deriving the global comparison. But a significantly different<br />
implicit quantities from national accounts expendi- relationship (based on Central European prices)<br />
ture data and specially collected price data and thenr prevails in the comparison within that group, and<br />
revaluingtheimplicitquantitiesineachcountryata this is the relationship presented in the separate<br />
single set of average prices. The average price index publication of the European.comparison.<br />
thus equalizes dollar prices in every country so that To derive ICP-based 1987 figures for countries<br />
cross-country comparisons of ONP based on them that are.yet to participate in any ICP survey an estireflect<br />
differences in quantities of goods and ser-. mating equation is first obtained by fitting the folvices<br />
free of price-level differentials. This procedure lowing regression to 1987 data:<br />
is designed to bring aoss-country comparisons in<br />
line vith cross-time real value comparisons that are ln(r) = 05932 ln(ATLAS) + 026 In(mL) + 0.6446;<br />
based on constant price series. (0.298) (0.0552) (0.1676)<br />
The ICP figures presented here are the results of a Ra or30 AdJR-Sq 0.95 N 80<br />
two-step exercise. Countries withiin a region or<br />
group such as the OECD are first compared using where all variables and estimated values are extheir<br />
own group average prices. Next, since group pressed as US = 100 and where<br />
average prices may differ from each other, mal


