

ASi" kUCTURE FlOR DEVELOPMENT
ASi" kUCTURE FlOR DEVELOPMENT
ASi" kUCTURE FlOR DEVELOPMENT

Create successful ePaper yourself
Turn your PDF publications into a flip-book with our unique Google optimized e-Paper software.
straint to their mobility (Figure 1.7) A study of tracted understandable publicattention Yetequally<br />
transport. options in Latin American cities found serious, and more pervasive, is the damage or loss<br />
that in Sao Paulo, Brazil, personal travel by the poor of potential benefits to the environment because of<br />
lad declined more sharply than for any other in- failure to control unnecessary emissions and wastecome<br />
group over a decade-partly because public ful consumption of water. This is due in particular<br />
transport services wvere ill designed for low-income to the underpricing of power, vehicle fuels, and<br />
users. The poorest residents on the periphery of Rio water for irnrgation and municipal uses and to the<br />
de Janeiro spent more of their income than the rich neglect of maintenance. Inadequate maintenance<br />
for transport, with longer waits, less frequent ser- practices leading to inefficient thermnal power genvice,<br />
and more time spent in crowded vehicles. eration account for a large share of energy-related<br />
Appropriate services for the poor are often lack- pollution. Neglect of sound environmental manageing<br />
when decisions on investment and service are ment practices m trmnsport-inlduding safe handriven<br />
by assumptions about a "needs gap' rather ding of hazardous cargos and appropriate disposal<br />
than by an assessment of effective demand. In the of waste from ships, port dredging, and vehide<br />
Makete District in Tanzania, a survey of households maintenance-is a common failing. Unregulated,<br />
undertaken to determine their transport needs in badly designed, or poorly managed municipal<br />
preparation for a proposed investment project re- water and sanitation infrastructure has often been<br />
vealed that improvement of the road network alone one of the biggest sources of urban environtmental<br />
would benefit only a few residents and that com- pollution. The focus of public spending on urban<br />
plementary measures were needed-including solid waste management often stops at collectionsupport<br />
to transport services (the introduction of few developing country cities meet environmental<br />
nonmotorized means of transport to replace head- standards for sanitary landfills.<br />
loading), simple improvements to paths and tracks, Many of the problems in infrasucture perforand<br />
rehabilitation of grinding mills. A retrobpective mance are mutually reinforcing, creating serious<br />
evaluation canied out after completion of the proj- economic and financial costs that make it more diffiect<br />
found that these low-cost improvements were cult for countries to achieve greater coverage and<br />
highly successful-and would likely have been left'. more modem services to better meet social and enout<br />
of the project if no inquiry into tme actual de- virorimental goals. Systemic problems point to sysmand<br />
of the communities had been undertaken. temic causes-and solutions.<br />
NEGLCr oF Tm EsvIRoNmar'r The impact of in- Diagnosis and directions for change<br />
frastructure on the environment has often been very<br />
negative (Box 1.7 recounts one of many examples, T7ie conditions for improved performance: causes<br />
and one where regional cooperation is needed to de- and czares<br />
velop a solution). The highly visible effects of cer-<br />
- -tain large-sce facilities-such as dams and roads Where nastruciure is operated inefficently and<br />
in sensitive ecological areas or where resettlement delivers poor service, the solution cannot be simply<br />
options are unsatisfactory to populations-have at- to tell suppliers to do more maintenance and to<br />
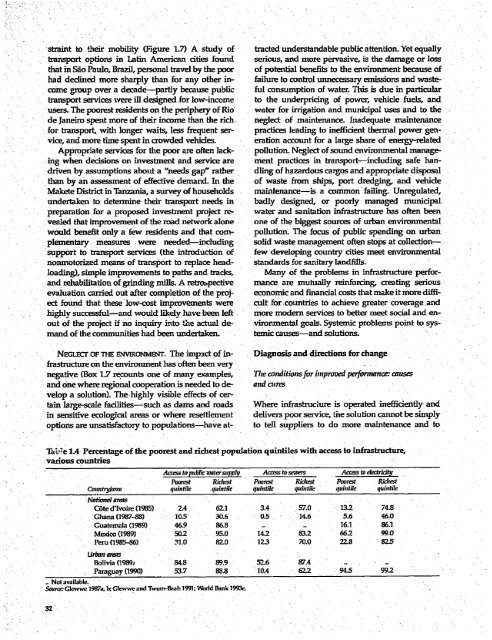
TzIcWe IA Percentage of the poorest and richest population quintiles with access to infrastructure,<br />
various countries<br />
Accss to pubcir wnaer supply Acess to sras Access to electriisy<br />
Pourest Ridicest Powrest Rihest Pcorcst Richest<br />
Cornhtryla/n quintile qintile quintil quintile qurintile quintile<br />
National areas<br />
C6te d'lvoire (1985) 2.4 62.1 3.4 57.0 13.2 74.8<br />
Ghana (1987-88) 105 30.6 0.5 14.6 5.6 46.0<br />
Guatemala (1989) 46.9 86.8 - .. 16.1 86.1<br />
Mexico 0989) 50.2 95.0 14.2 83.2 66.2 99v0<br />
Peru (1985-86) 31.0 82.0 12.3 70.0 22.8 -825<br />
Urban arras<br />
Bolivia (198%9 84.8 89.9 52.6 87.4<br />
. Paraguay (1990) 53.7 88.8 IOA 62.2 94.5 992<br />
- Not available.<br />
SonerCGlewwe 1987a, b; Clewwive and Twum-Baah 1991: World Bank 1993e.<br />
32


