ASi" kUCTURE FlOR DEVELOPMENT
ASi" kUCTURE FlOR DEVELOPMENT
ASi" kUCTURE FlOR DEVELOPMENT
You also want an ePaper? Increase the reach of your titles
YUMPU automatically turns print PDFs into web optimized ePapers that Google loves.
*:: Appendix: Infrastr cture data<br />
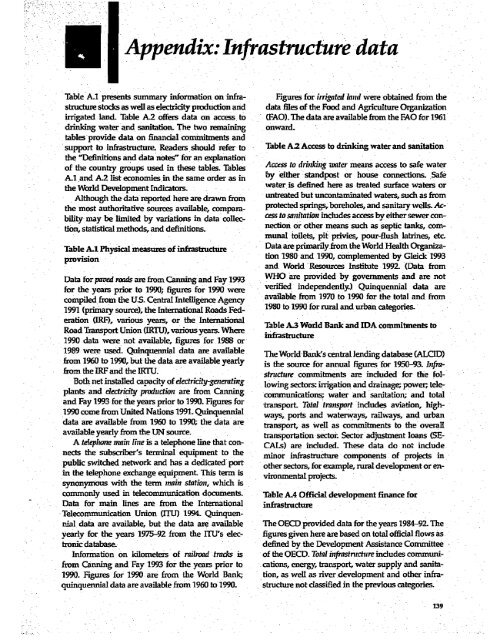
Table A.1 presents summary information on infra- Figures for inigated land were obtained from the<br />
structure stocks as well as electricity production and data files of the Food and Agriculture Organization<br />
irrigated land. Table A2 offers data on access to (FAO). The data are available from the FAO for 1961<br />
drinking water and sanitation. The two remaining onward.<br />
tables provide data on financial commitments and<br />
support to infrastructure Readers should refer to Table A2 Access to drinking water and sanitation<br />
the "Definitions and data notes" for an explanation<br />
of the country groups used in these tables. Tables Access to drinkin -ater means access to safe water<br />
Al and Al list economies in the same order as in Fty either standpost or house connections. Safe<br />
the World Development indicators -*vwater is defined here as treated surface waters or<br />
Although the data reported here are drawsn fromn untreated but uncontaminated waters, such as from<br />
the most authoritative sources available, compara- protected springs, boreholes, and sanitary wells. Acbility-<br />
may be limited by variations in data collec- acss to sanitatioI includes access by either sewer contion,<br />
statistical methods, and definitions.<br />
necton or other means such as septc tanks, communal<br />
toilets, pit privies, pour-flush latrines, etc<br />
Table A.1 Physical measures of infrastructure Data are primarily from the World Health Organizap-rovision<br />
tion 1980 and 1990, complemented by Gleick 1993<br />
and World Resources Institute 1992. (Data from<br />
Data for paed roads are from Canning and Fay 1993 WHO are provided by govenments and are not<br />
for the years prior to 1990; figures for 1990 were verified independently.) Quinquenmial data are<br />
compiled from the US. Central Intelligence Agency available from 1970 to 1990 for the total and from<br />
1991 (primary source), the Intenational Roads Fed- 1980 t 1990 for rural and urban catoes<br />
eration (IRF), various years, or the International<br />
Road riansport Union (IRLTU), vanous years- Where<br />
1990 data were not available, figures for 1988 or<br />
1989 were used. Quinquennial data are available TheWorldBankscentrallendingdatabase(ALCID)<br />
from 1960 to 1990, but the data are available yearly is the source for annual figures for 1950-93. Infrafrom<br />
the IRF andthelIRTU. -structure commitments are included for the fol-<br />
Both net installed canacty of electricity-generating lowing sectors: irgation and drainage; powern teleplants<br />
and electricity production are from Canning communications; water and sanitation; and total<br />
and Fay 1993 for the years prior to 1990. Figures for ts t<br />
1990comefi-m<br />
UntedNatins 991-Quiquenial -transport. Total trrnsport indudes aviation, high<br />
1990 come from United Nations 1991. Quincinennial ways, ports and waterways, railways, and urban<br />
data are available from 1960 to 1990; the data are transport as well as commitments to the overall<br />
available Avalablne yearly yearly from firomze<br />
the UJN<br />
UNS a<br />
sourceseIephoue<br />
transportation sector. Sector adjustment loans (SE-<br />
Atlephonemain lineisa telephonelinethat con- CALs) are included. These data do not include<br />
nects the subscriber's terminal equipment to the *or ifrstrucure components of projects in<br />
public switched network and has a dedicated port other sectors, for example, rural development or enm<br />
the telephone exchange equipment This term is vunentat projects.<br />
synonymous with the term mnain station, which is<br />
commonly used in telecommunication documents. Table A4 Official development finance for<br />
Data for main lines are from the International infrastructure<br />
-Telecommunication Union TU) 1994 Quinquennial<br />
data are available, but the data are available The OECD provided data for the years 1984-92. The<br />
yearly for the years 1975-92 from the iTL's elec- figures given here are based on total official flows as<br />
tronic database.<br />
defined by the Development Assistance Committee<br />
Information on kilometers of railroad tracks is of the OECl:) Total infrastnrcture indudes communifrom<br />
CannIng and Fay 1993 for the years prior to cations, energy, transport, water supply and sanita-<br />
1990. Figures for 1990 are from the World Bank; tion, as well as river development and other infraquinquennial<br />
data are available from 1960 to 1990. structure not classified in the previous categories.<br />
139


